Matching the published recording sets
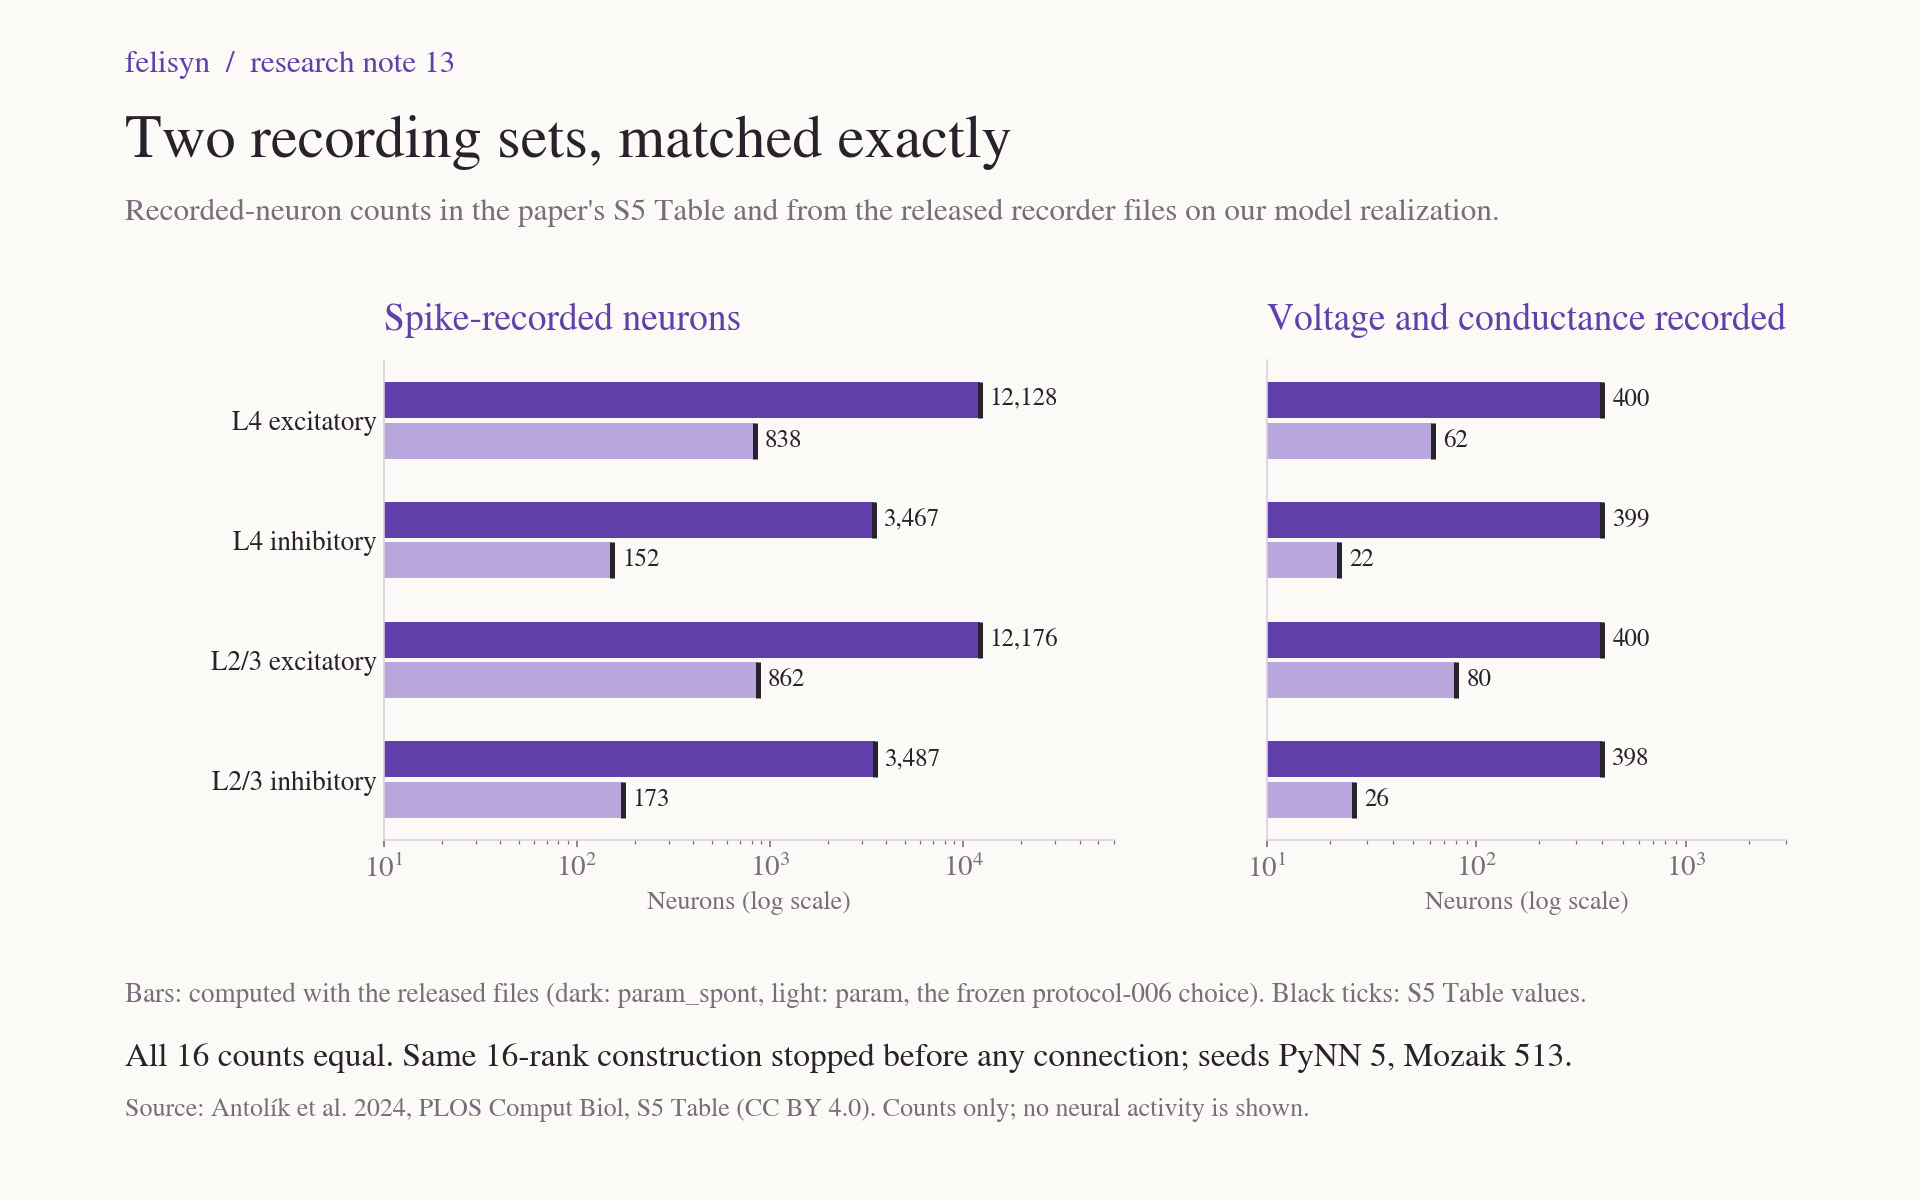
On our build of the model, the released recorder files match all 16 recorded-neuron counts in the paper's S5 Table, and the published firing-rate histograms need more neurons than our frozen plan records. The plan sampled the evoked-activity set.
The cat visual-cortex model records only a sample of its neurons, and the paper's supplementary S5 Table lists two different samples: one for spontaneous activity and one for evoked activity. We built the released model with our pinned code and seeds, stopped before any connection was made, and applied both released recorder recipes. All 16 recorded-neuron counts match the S5 Table exactly. The spontaneous counts are exactly those selected by the released spontaneous settings (param_spont). The evoked counts are exactly those selected by the general settings that our frozen protocol 006 uses.
We also measured the published spontaneous-activity figure itself. Its firing-rate histograms need more recorded neurons in every population than the general settings provide. Our frozen plan would therefore have compared a different, much smaller sample of neurons with the published values.
This follows the correction flagged in note 12. The model is the published LSV1M circuit of cat primary visual cortex, layers 4 and 2/3, not a whole brain. No simulation was run in this step.
Why we checked
Protocol 006 froze the model's general recording settings because they match the authors' only public archived run. That archived run, however, combined a spontaneous segment with evoked experiments, so its recording settings may reflect the evoked protocols. The paper's S5 Table lists a separate and much larger set for spontaneous activity. Recording settings decide which neurons a statistic is averaged over. If the published spontaneous statistics (the paper's Figure 4) used the larger set, our planned comparison would compute the statistics from a different, much smaller sample of neurons than the published values.
Method
A short probe script ran the unchanged model files under 16 MPI processes, with PyNN seed 5 and Mozaik's default seed 513. Because the server has four vCPUs, the processes were started with Open MPI's --oversubscribe option; the frozen launcher does not use it. The 37 model files matched the protocol's hashes in a check just before the probe, and again in a retained, dated re-check. The probe stops the model's construction at the first connection step, when every neuron sheet exists and no synapse does. On each cortical sheet, it applies both released recorder definitions with the framework's own selection code, records the counts, and compares them with our transcription of S5 Table. The two parameter sets differ only in their recorders.
The first attempt failed before any model code ran: the framework evaluates command-line values as Python expressions, and our output path lacked quotes. The second attempt, with only the quoting changed, produced the result. Both attempts are retained. The probe took 16 minutes on the four-vCPU research server.
What the counts show
| Population | Spontaneous set: spikes · voltage/conductance | Evoked set: spikes · voltage/conductance |
|---|---|---|
| Layer 4 excitatory | 12,128 · 400 | 838 · 62 |
| Layer 4 inhibitory | 3,467 · 399 | 152 · 22 |
| Layer 2/3 excitatory | 12,176 · 400 | 862 · 80 |
| Layer 2/3 inhibitory | 3,487 · 398 | 173 · 26 |
Each recorder places a grid of virtual electrodes over the sheet, selects the neuron nearest to each grid point and drops duplicates. Most counts therefore depend on exactly where the neurons sit. The two excitatory voltage counts of 400 are an exception: they equal the number of grid points and would match under almost any placement. The dense spike counts and the central evoked counts are the informative ones. That all of them match makes it unlikely that our build places neurons differently from the authors'. We have not quantified this, and the authors' selected neuron identities are not available. Nothing here concerns connections or activity yet.
What the published figure shows
The paper's Figure 4G shows histograms of firing rates on logarithmic axes. In the released plotting code, each plotted value is a count of neurons divided by 0.2 times the number of neurons in the histogram. The smallest plotted value therefore sets a minimum on that number. We measured the published figure from its axis tick marks; one pixel is about 3% of a decade.
| Population | Neurons needed (allowing 1 pixel of error) | General settings record | Spontaneous settings record |
|---|---|---|---|
| Layer 4 excitatory | at least 1,173 (1,089) | 838 | 12,128 |
| Layer 4 inhibitory | at least 1,151 (1,067) | 152 | 3,467 |
| Layer 2/3 excitatory | at least 2,005 (1,860) | 862 | 12,176 |
| Layer 2/3 inhibitory | at least 1,733 (1,607) | 173 | 3,487 |
The general settings cannot have produced the published panels; for the inhibitory populations they fall short seven- to tenfold. In the released code, the figure file of that name is written only by the model's spontaneous analysis, which the released instructions run with the spontaneous settings.
Evidence that points the other way
The authors' archived run, which uses the general settings, contains the same 40.32-second spontaneous segment and lists a Figure 4 image. Its figure entries, however, come from three different analysis functions and have blank code and caption fields, so they do not establish which run produced each figure. The paper's Methods (section 4.3) say recorded neurons were "always restricted to the central circular patch (radius of 1 mm)", except in size tuning. They also say voltage and conductances were recorded from "a subset of 190 neurons confined to the central 0.2 × 0.2 mm patch". Read literally, both conflict with the spontaneous set. The 190, and the "2025 randomly selected neurons" given for the evoked protocols, equal S5's evoked totals, so we read that section as describing the evoked recordings. Weighing all of this, the published spontaneous statistics were most likely computed from the spontaneous set. That remains an inference: no record of the authors' Figure 4 run is available.
What changes
We are not editing protocol 006; it remains the record of what we planned. The full run will instead use a new, versioned protocol with the released spontaneous settings and otherwise unchanged comparison rules. The spontaneous set contains 836 of 838, 152 of 152, 856 of 862 and 173 of 173 of the neurons that protocol 006 would have spike-recorded. A secondary comparison of spike-based measures on that subset therefore stays possible. Most of protocol 006's small central voltage and conductance sample would not be recorded.
The change has a cost. The spontaneous set records about 15 times as many spike trains (31,258 versus 2,025) and about 8 times as many voltage and conductance traces (1,597 versus 190 neurons). Its memory and storage needs have not been measured yet.
By our reading of the framework's code, recorders are set up only after the network is fully built. The cortical grid selectors, the only recorder settings that differ between the two parameter sets, draw no random numbers. The LGN recorders do, but they are identical in both sets. Switching settings should therefore change which neurons are sampled, not the network. That is a reading of source code, not yet a comparison of two full runs.
Limits
The probe covered neuron positions and recorder selection only, with no connections, inputs or dynamics. The figure bounds assume the published panels used the released plotting code; their layout, axis ranges and bin width match it. Which recording set produced Figure 4 is inferred from the paper, the figure, the code and the released instructions.
Evidence and sources
- Recipe-check package, README, result summary and SHA-256 manifest.
- Probe script, counts receipt, model-file check, failed first attempt and S5 transcription.
- Figure measurement script, measurement output and bounds.
- Antolík et al. (2024), its S5 Table and Figure 4; LSV1M v1.0; Mozaik v0.4.0. Licences: paper and supplements CC BY 4.0; LSV1M MIT; Mozaik CeCILL.