The full model ran: all 24 printed means matched
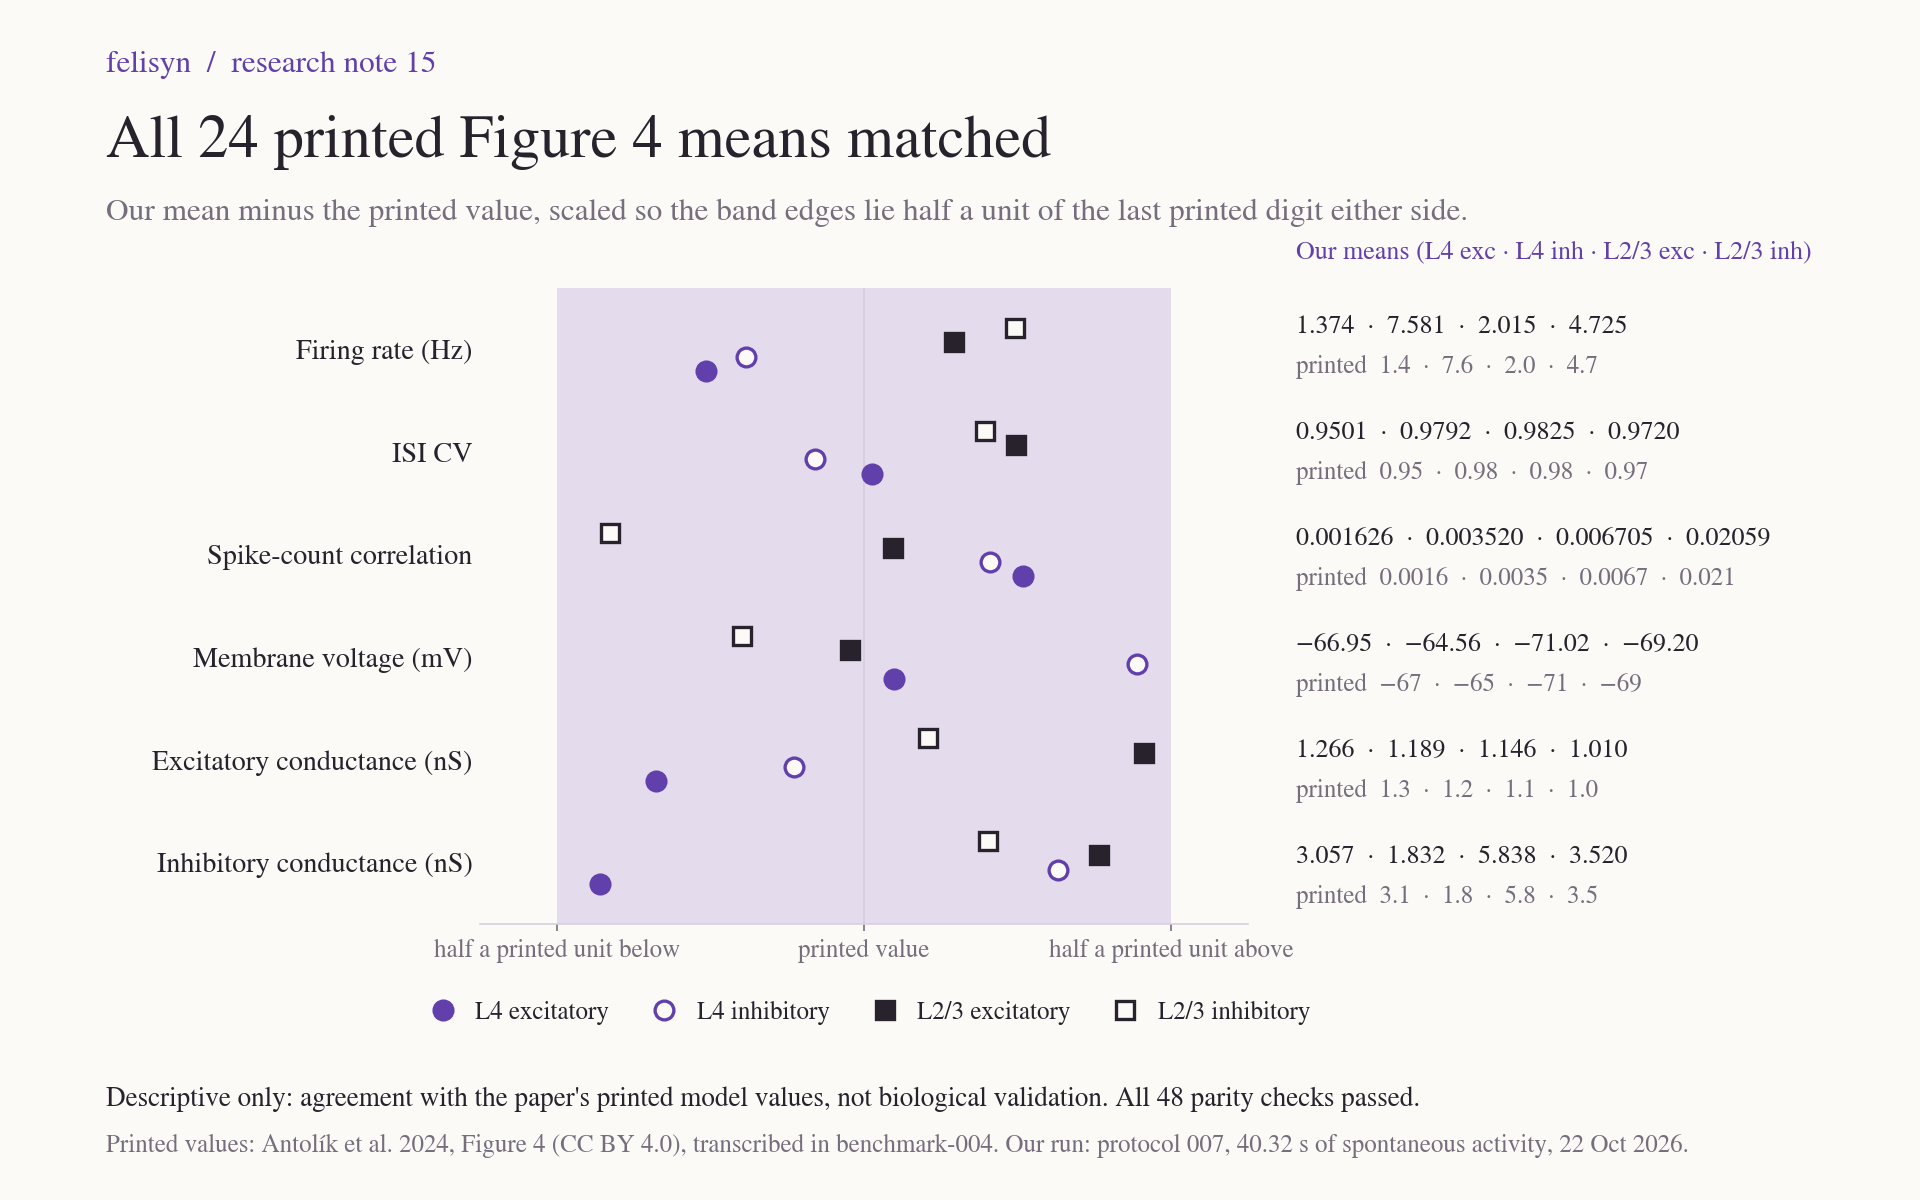
The full cat visual-cortex model, 108,150 neurons and 40.32 seconds of spontaneous activity, ran end to end on our existing 8 GB server in 15 hours. All 24 population means the paper prints in Figure 4 are matched at printed precision. This is agreement with the paper's model numbers, not biological validation.
Update, 7 November 2026: the run's larger files, 39 files and 3.10 GB (the datastore and the voltage and conductance exports), were kept only on our research server. That server has been lost, so these files can no longer be read. Their hashes and sizes stay published, and the run's results, receipts and all spike times stay on this site. Note 23 has the details. The entry below is unchanged, so its line that the larger arrays stay on our server no longer holds.
For the first time in this project, the full published model of cat primary visual cortex has run from start to finish. It has 108,150 neurons and 99.4 million connections in layers 4 and 2/3 and the thalamic input. It simulated 40.32 seconds of spontaneous activity under the frozen protocol 007, on the four-vCPU, 8 GB server described in note 14. That took 14 hours 57 minutes. All 24 population means that the paper prints in its Figure 4 are matched at the printed precision: firing rate, spiking irregularity, pairwise correlation, membrane voltage and the two synaptic conductances, in four populations. Our own analysis code and the numerical part of the authors' Figure 4 code agree on all 48 means and SDs.
This is agreement with the numbers the paper reports for the same model. It is not a test against real cat brains. It is not a full reproduction check either, because the paper's unrounded values are not public. It runs nothing in a controller.
What ran
The run used the model's released files and the released spontaneous-activity settings. The protocol was frozen before the run started. The simulator ran as one process with 16 threads, 16 virtual processes in total, as tested in note 14. After every simulation step, the run wrote a receipt:
- a 150-millisecond blank screen;
- the 40,320-millisecond spontaneous segment that is measured;
- two more 150-millisecond blanks.
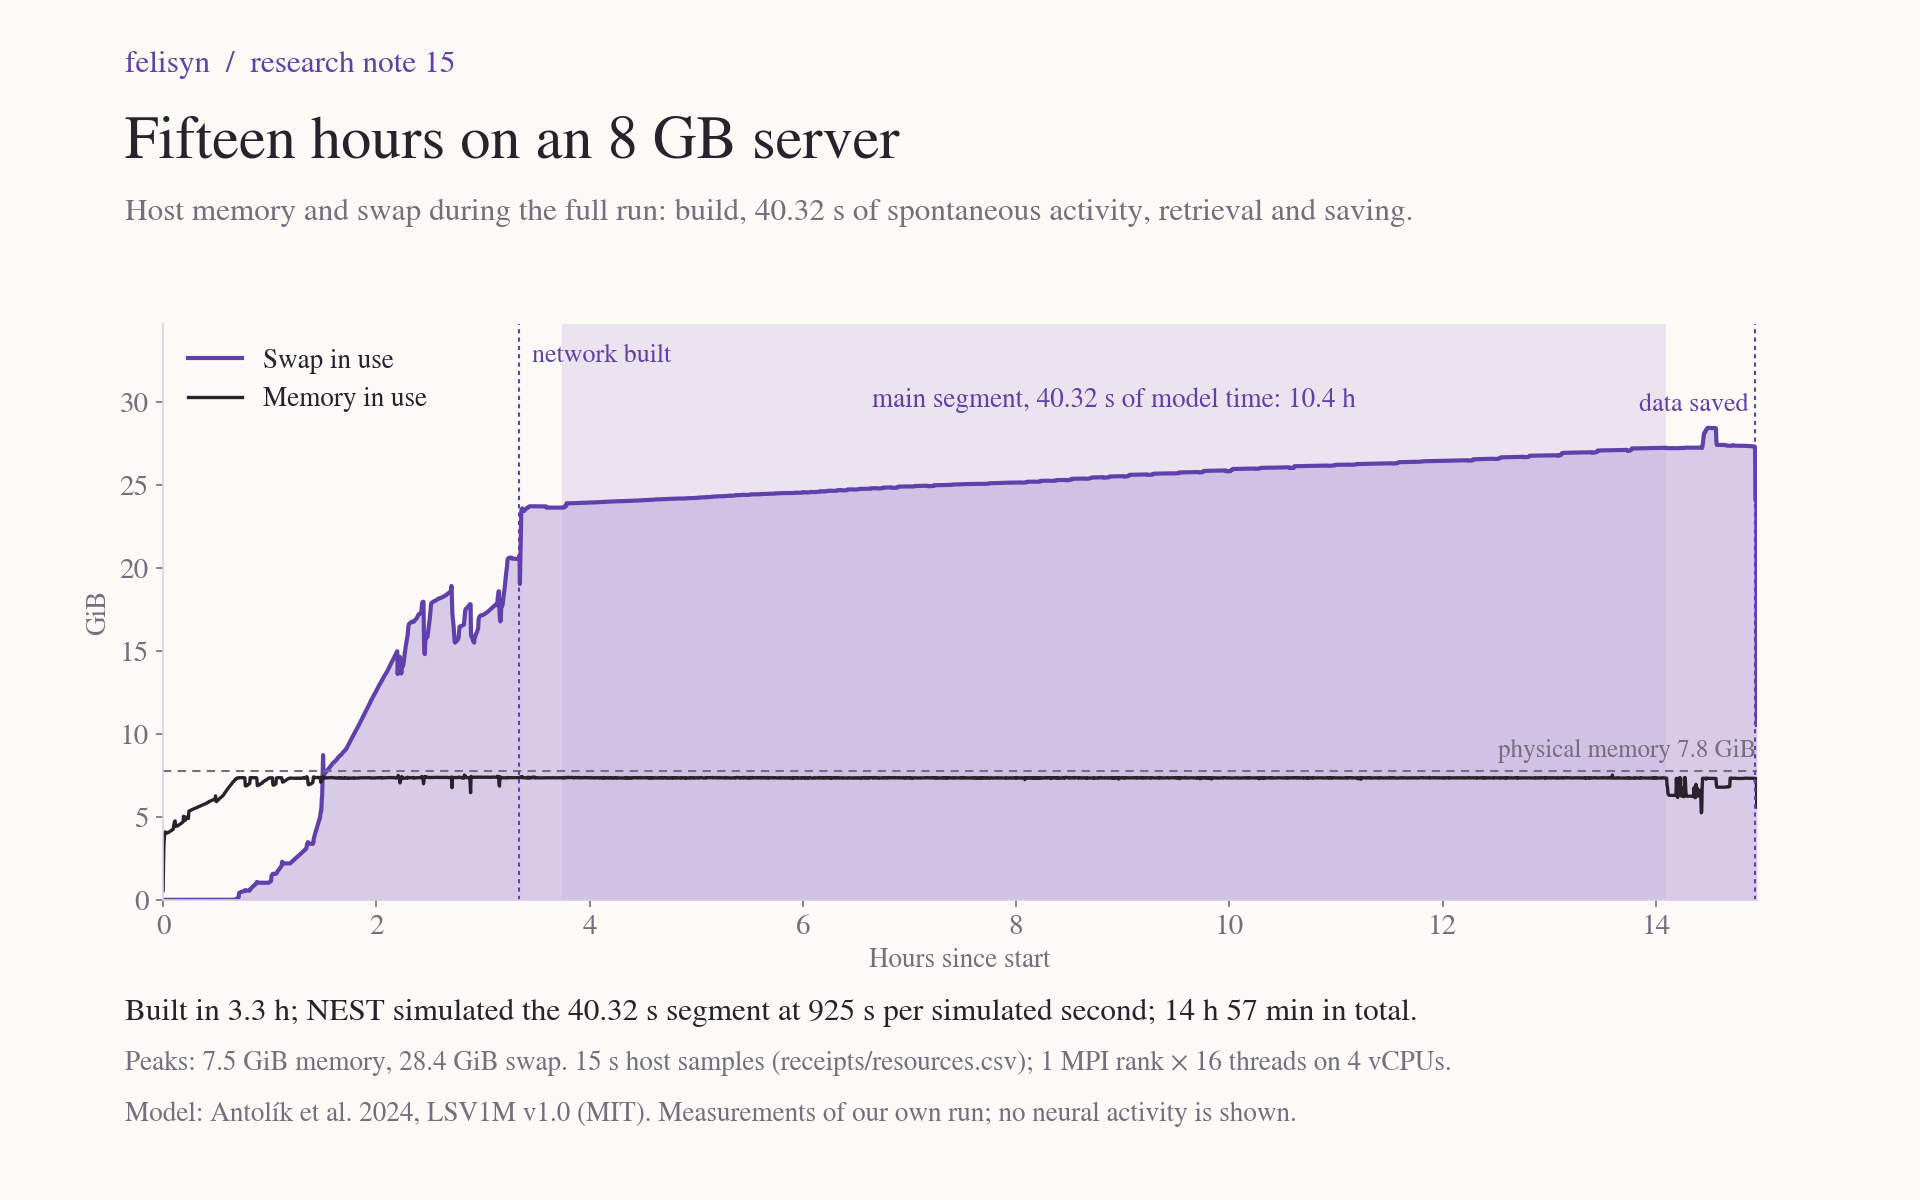
The four steps ended at exactly the planned 40,770.1 milliseconds of model time. The network took 3.3 hours to build. The main segment took 10.4 hours, about 925 seconds of computing per simulated second. Retrieving and saving the recordings took under an hour. Memory peaked at 7.5 GiB and the swap file at 28.4 GiB.
Results
| Population | Firing rate (Hz) | ISI CV | Spike-count correlation |
|---|---|---|---|
| Layer 4 excitatory | 1.374 (1.4) | 0.950 (0.95) | 0.00163 (0.0016) |
| Layer 4 inhibitory | 7.581 (7.6) | 0.979 (0.98) | 0.00352 (0.0035) |
| Layer 2/3 excitatory | 2.015 (2.0) | 0.982 (0.98) | 0.00670 (0.0067) |
| Layer 2/3 inhibitory | 4.725 (4.7) | 0.972 (0.97) | 0.0206 (0.021) |
| Population | Membrane voltage (mV) | Excitatory conductance (nS) | Inhibitory conductance (nS) |
|---|---|---|---|
| Layer 4 excitatory | −66.95 (−67) | 1.266 (1.3) | 3.057 (3.1) |
| Layer 4 inhibitory | −64.56 (−65) | 1.189 (1.2) | 1.832 (1.8) |
| Layer 2/3 excitatory | −71.02 (−71) | 1.146 (1.1) | 5.838 (5.8) |
| Layer 2/3 inhibitory | −69.20 (−69) | 1.010 (1.0) | 3.520 (3.5) |
Values printed in the paper are in brackets. The statistics use the full 40.32-second window and every recorded neuron: 31,258 spike trains, plus voltage and conductance traces from 1,597 neurons. ISI CV and correlation use the 27,512 neurons with at least 7 spikes. Each statistic was computed twice: by our independent code, and by the numerical part of the authors' own Figure 4 code, extracted unmodified and stopped before any plotting. All 48 means and SDs agree to within 10⁻¹⁵.
"Matched at printed precision" means that each of our values rounds to the printed one. The paper prints one or two significant digits, so this is a coarse test: for a printed 1.4 hertz, anything from 1.35 to 1.45 counts.
The smaller sample
Our first plan, protocol 006, would have recorded far fewer neurons, mostly in the centre of the sheet. A declared secondary analysis computed the spike measures for the 836, 152, 856 and 173 of those neurons that this run also recorded. Their firing rates and irregularity are close to the full sets. Their pairwise correlations are 4.4 to 9.4 times higher: 0.103 instead of 0.021 for layer 2/3 inhibitory cells, for example. This fits our earlier conclusion that the published statistics came from the larger, spread-out set (note 13), but it does not prove it.
Two corrections
NEST, the simulator, also has a random seed of its own. It was 42, PyNN's default, because the framework does not pass one. This is how the released code runs, but our protocol did not record it.
Protocol 007 says that in the small split test, the first recorded voltage sample "differed by up to 10 mV". That is the difference between sorted sets of values. Per neuron, it reaches 13.0 millivolts for the split used here, the figure note 14 gives. Both are explained in the run package.
Limits
This is one run with one set of seeds on one machine. The 1 × 16 split was not checked bitwise against a 16-process run at full scale. The match is at printed precision only. One older question also remains open: the paper's text gives an average inhibitory conductance of 3.56 nS, while the population-weighted average of its rounded Figure 4 values is about 4.09 nS. Agreeing with a model's published numbers is a result about software and numerical agreement. It is not evidence about real cat visual cortex. No controller work exists yet.
Follow-up, 23 October 2026: Note 16 tests the averaging rules. The text values are most likely equal-weight averages, not size-weighted ones (an inference).
Evidence and sources
- Run package (without the spike file), README, run summary and SHA-256 manifest.
- Analysis parity receipt, printed-value comparison, secondary analysis and all spike times (12 MB). The larger voltage and conductance arrays stay on our server, with their hashes and sizes published.
- Launcher record, complete run log and the source of the simulator seed.
- Antolík et al. (2024), LSV1M v1.0, Mozaik v0.4.0, NEST 3.4, PyNN 0.11.0. Licences: paper CC BY 4.0; LSV1M MIT; Mozaik CeCILL.