Two ways to average: the 3.56 nS question
The paper's text gives an average inhibitory conductance of 3.56 nS, while its Figure 4 code implies about 4.09 nS. Using our full run, both averages in the text are reproduced when every population counts about equally, and neither when the populations are weighted by size. The discrepancy most likely comes from how the averages were taken. This is an inference from one run; the code behind the text is not public.
Since we specified the reference values in note 8 on 9 October, one question about the published numbers has stayed open. The paper's text says the model's inhibitory synaptic conductance during spontaneous activity "was 3.56 nS when averaged across all model neurons". The paper's Figure 4 code computes its own average, weighting the four populations 1 : 0.25 : 1 : 0.25, in proportion to their sizes. Applied to the values printed in Figure 4, that average gives about 4.09 nS. The gap is larger than the rounding of the printed values.
Our full run (note 15) now gives the four population means at full precision. Our analysis code and the authors' Figure 4 code agree on them. So we could test which way of averaging produces the numbers in the text, for both conductances.
What we compared
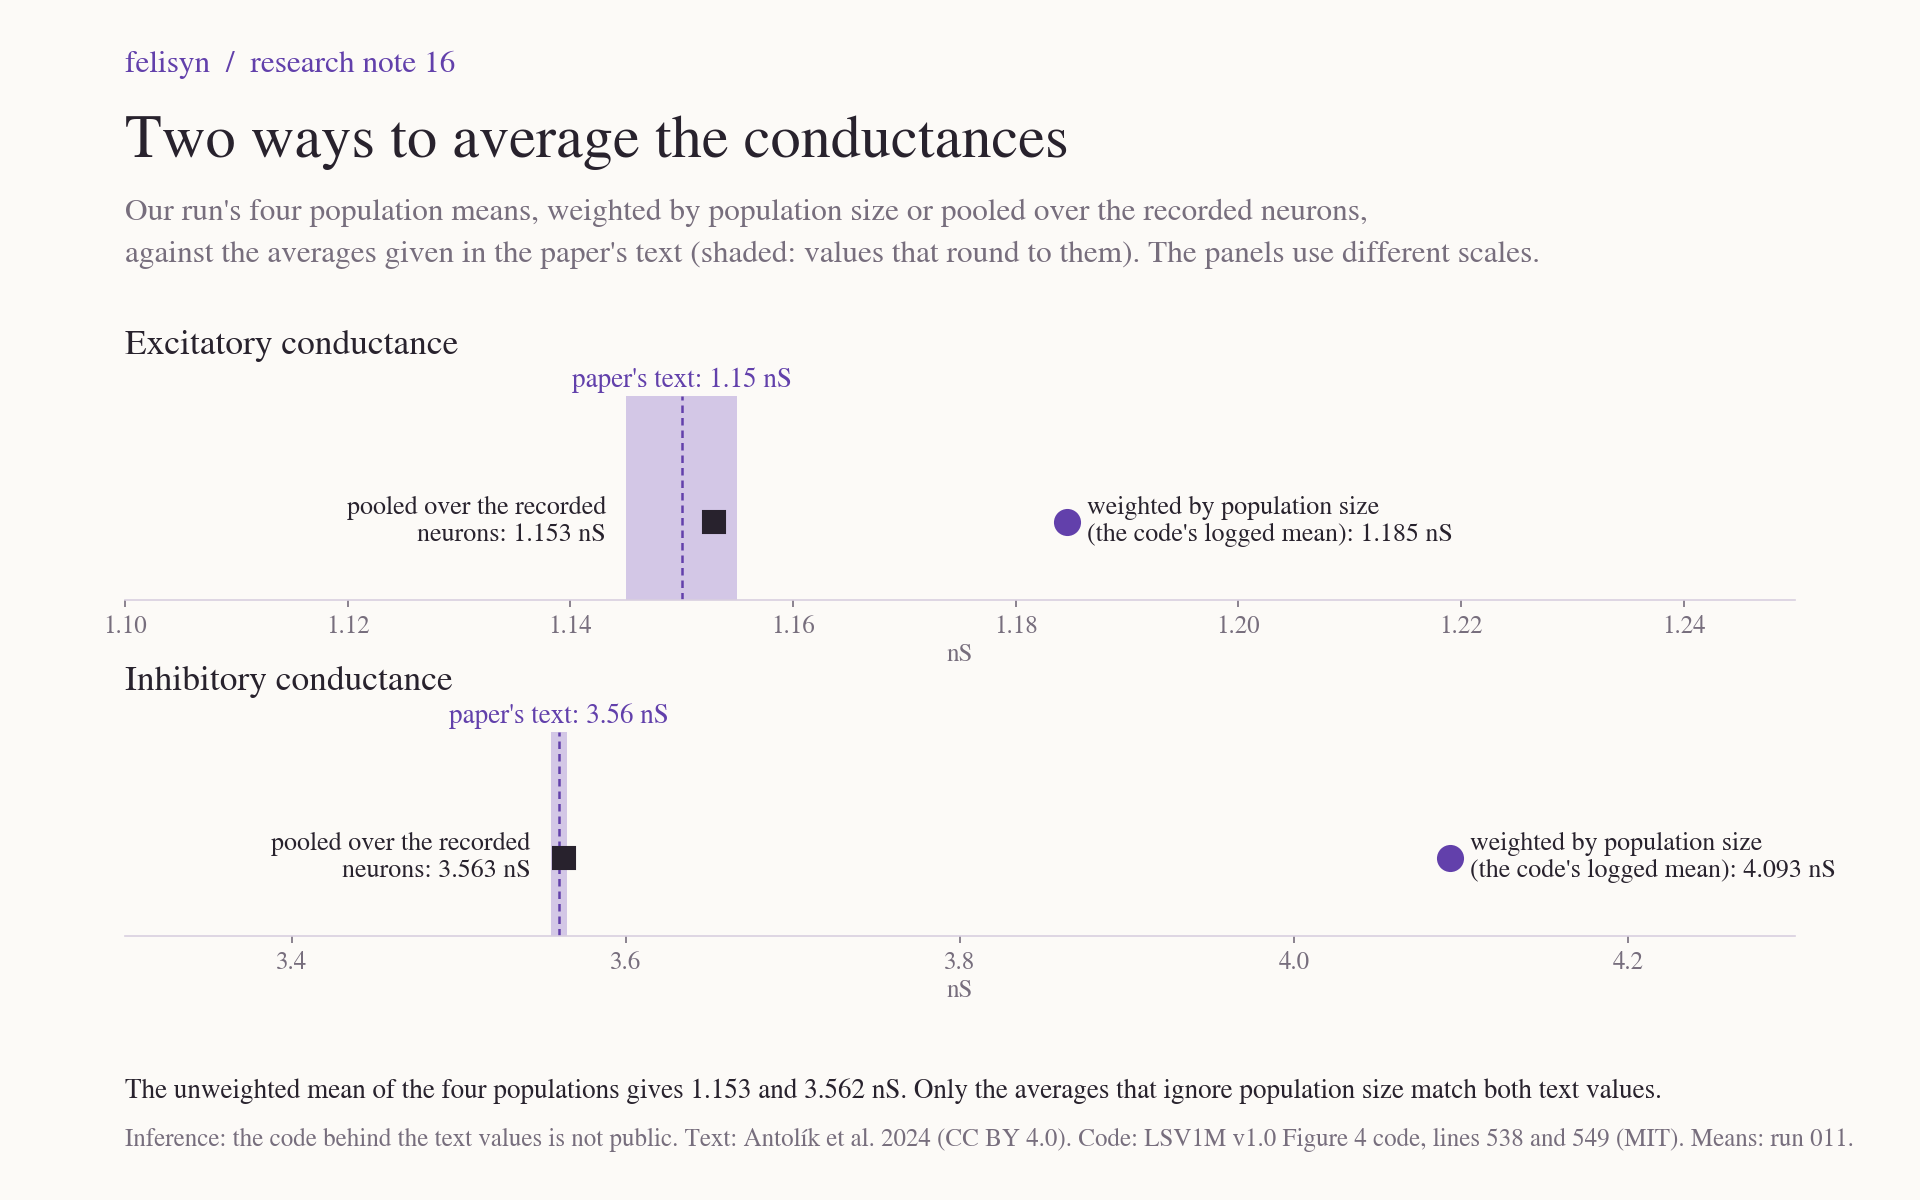
The paper gives two averages in its text: 1.15 nS for the excitatory conductance, "averaged across all layers", and 3.56 nS for the inhibitory one. We combined our run's four population means in three ways: weighted by population size, as the Figure 4 code does; pooled over the recorded neurons; and as a plain mean of the four populations.
| Rule | Excitatory (nS) | Inhibitory (nS) | Matches the text |
|---|---|---|---|
| Size-weighted (Figure 4 code) | 1.185 | 4.093 | Neither value |
| Pooled, recorded neurons | 1.153 | 3.563 | Both values |
| Plain mean, 4 populations | 1.153 | 3.562 | Both values |
| Paper's text | 1.15 | 3.56 |
The model has four times as many excitatory as inhibitory neurons, so size weighting gives the excitatory populations more say. Their inhibitory conductances are the larger ones (3.06 and 5.84 nS against 1.83 and 3.52 nS). The recorded voltage and conductance traces, by contrast, come from about 400 neurons in each population. An average over the recorded neurons therefore treats the four populations about equally.
A value counts as a match when it rounds to the number in the text. The averages that ignore population size match both values to all three printed digits. Size weighting matches neither.
What it means
The 3.56 nS in the text is most likely an average in which each population counts about equally. That could be the average pooled over the recorded neurons or the plain mean of the four population means. The two differ by at most 0.0012 nS, so we cannot tell them apart. Either way, it is not an average over all neurons in the model. The discrepancy most likely comes from how the averages were taken. It probably does not reflect a difference between the paper's model and its figure, or between our run and the paper's.
This is an inference. The code that produced the numbers in the text is not public, and some other averaging rule could round to the same values. Two observations support it:
- From the printed Figure 4 values alone, size weighting cannot give 3.56 nS: it gives 4.09 ± 0.05 nS.
- With our run's means, equal weighting rounds to both values in the text and size weighting rounds to neither. Size weighting misses the excitatory value by 0.035 nS, about seven times the spread expected from recording a different set of neurons.
Nothing else changes. The 24 Figure 4 means remain our declared comparison target, and the frozen protocols are not edited.
One point carries forward to the biological comparisons ahead. The paper compares its 3.56 nS with the 4.9 nS it cites from cat recordings (Monier, Fournier and Frégnac 2008). Weighted by population size, the model's average is 4.09 nS. Which model average, if either, suits that comparison depends on which neurons and layers the cat recordings sampled. We have not yet checked that source.
Limits
This rests on one run. The second observation assumes our run is close to the paper's, which the 24 printed matches support but do not prove. The three-digit match of the equal-weight averages is consistent with the explanation but is not strong evidence by itself: recording a different set of about 400 neurons per population would move the inhibitory average by about ±0.011 nS, more than the rounding tolerance. The clear finding is that size weighting does not produce the values in the text.
Evidence and sources
- Package README, computation, tests, computed values, SHA-256 manifest and ZIP.
- Inputs, checked by hash: run 011's parity receipt, the printed Figure 4 values, the pinned Figure 4 code (lines 538 and 549) and the article text.
- Antolík et al. (2024), CC BY 4.0; LSV1M v1.0, MIT. Cat measurements cited by the paper: Monier, Fournier and Frégnac (2008).