First test against independent cat recordings
We compared the full model's spontaneous membrane potential with intracellular recordings from cat visual cortex that the model was not built on, under a protocol frozen before any of these statistics existed. The model's membrane potential decorrelates about eight times faster than in the recordings, and nearby neurons are less synchronized overall. Above 20 Hz their synchrony is comparable. The recordings come from anaesthetized cats, so this describes a difference; it is not a pass or fail.
Until now our full run (note 15) had only been compared with the numbers its own authors published. That shows the software runs the model as published. It says nothing about real cats. This note reports the first comparison with intracellular recordings from cat primary visual cortex that the model was not built on, published by other authors.
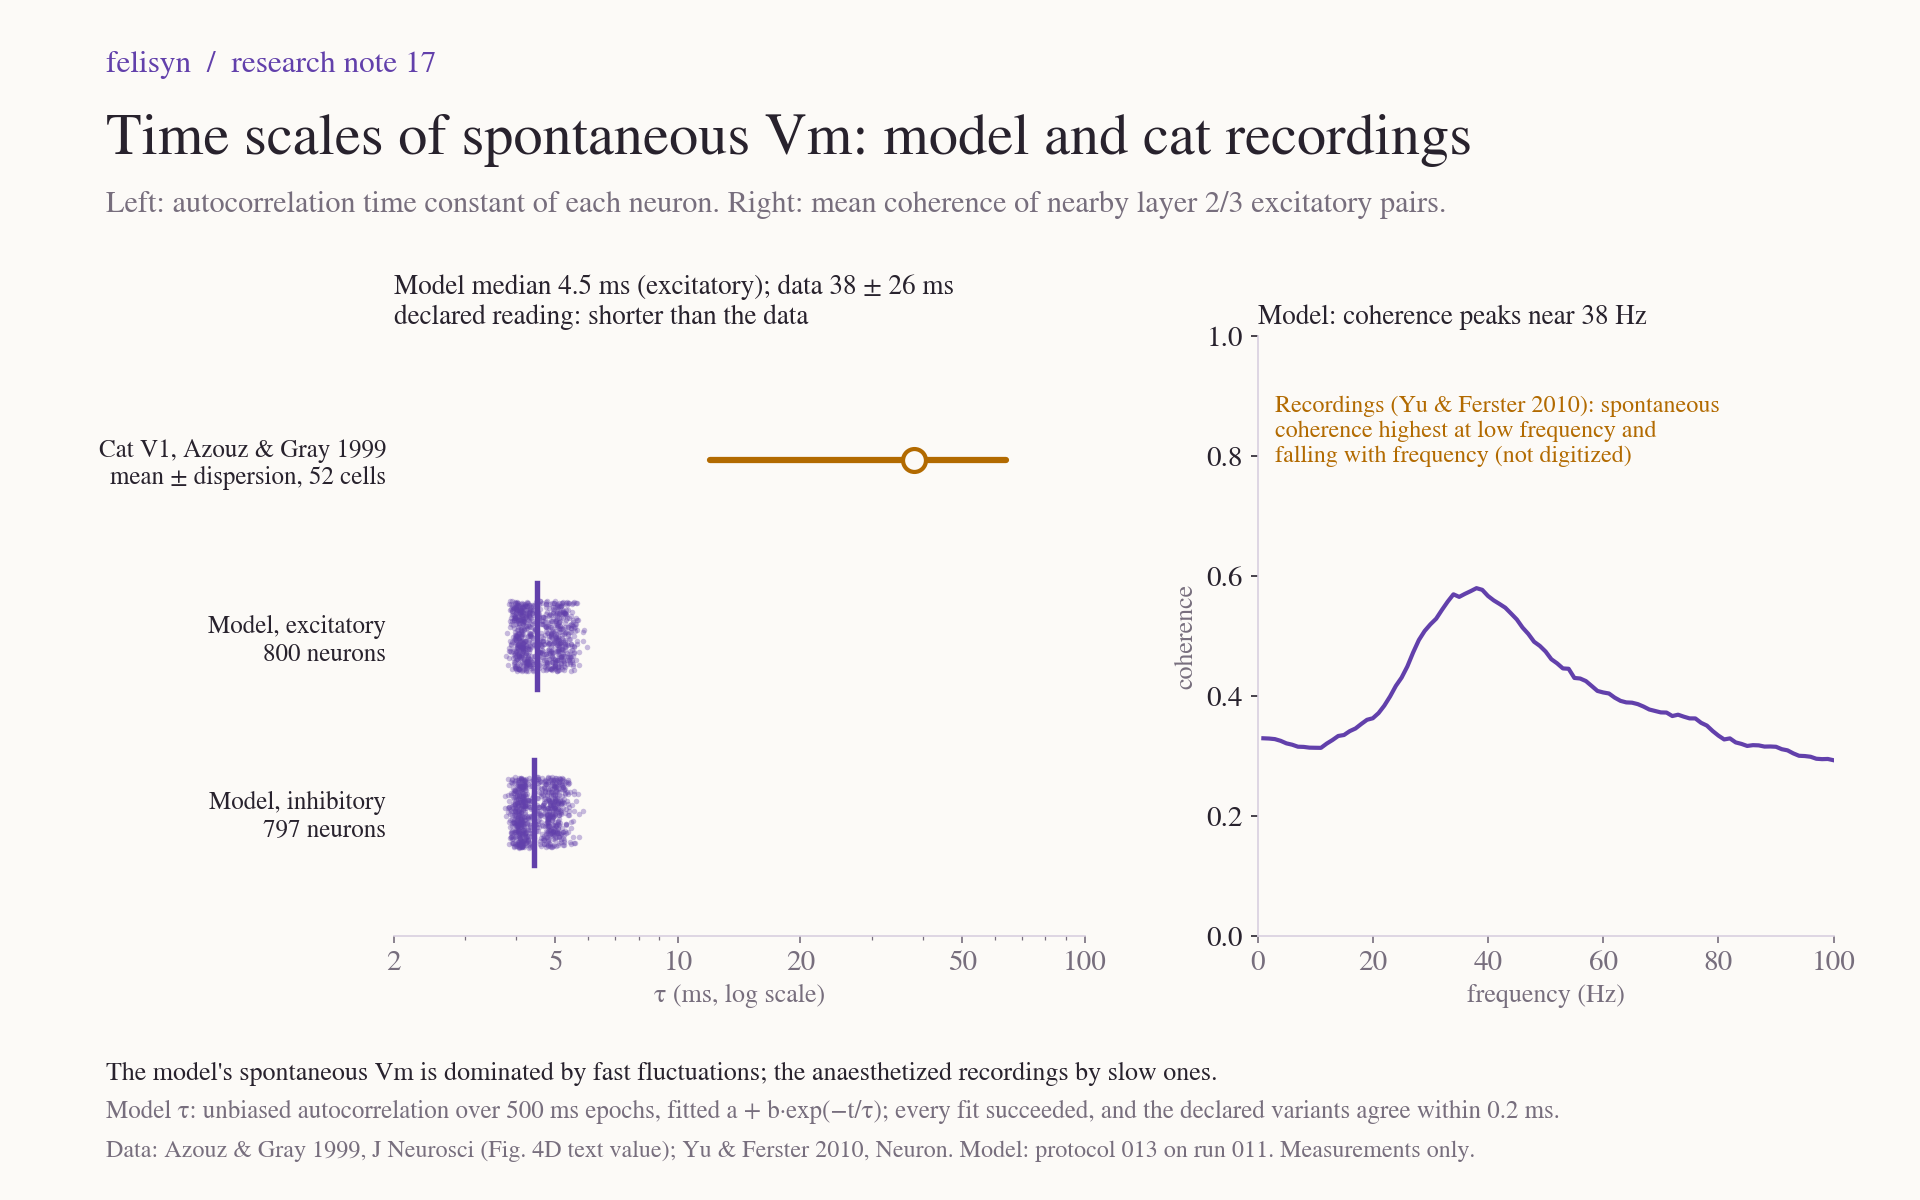
The headline: the model's spontaneous membrane potential runs on a much faster time scale than in the recordings. A model neuron's membrane potential decorrelates with a time constant of about 4.5 milliseconds, against 38 ± 26 milliseconds measured. Nearby model neurons are less synchronized overall, but above 20 Hz their synchrony falls in the measured range. The recordings come from anaesthetized cats, and anaesthesia commonly produces slow, synchronized fluctuations. The model's own fast membrane and synapses are another contributor, and these data cannot separate the two. This result describes a difference; it is not a verdict on the model.
Declared before we looked
A comparison chosen after seeing the model's numbers could pick whatever happens to agree. So we fixed everything first in protocol 013:
- The two sources. A literature search ranked 22 sources by how independent they are of the model, and two were chosen. Yu and Ferster (2010) recorded pairs of nearby neurons in layer 2/3 simultaneously and measured how strongly their membrane potentials move together. Azouz and Gray (1999) measured how fast a single neuron's membrane potential decorrelates. The model's paper cites neither publication, though it cites other papers from the same laboratories.
- The methods, as close as the model data allow. We followed each source's analysis: one-second blocks, the same cross-correlation formula, a 20 Hz Butterworth high-pass and the same exponential fit. We declared five deviations, such as the model's 1 kHz sampling and our choice of filter order.
- The recorded values. Yu and Ferster publish their 44 pairs only in a figure, so we digitized it. 37 and 32 of the 44 symbols are visible in its two panels; the rest are hidden behind others. The declared limits allow for the hidden ones.
- The selection and the reading. We fixed which model neurons to compare, and which outcome would be read how, including the explanations we could not tell apart.
The protocol was reviewed twice before it was frozen. The reviews changed the digitization bounds, fixed the primary group of neurons for the time constant, and made the wording of the readings neutral. Its SHA-256 was recorded at 01:59:46 UTC on 23 October. The analysis started 37 seconds later and took six and a half minutes on our server.
Synchrony of nearby neurons
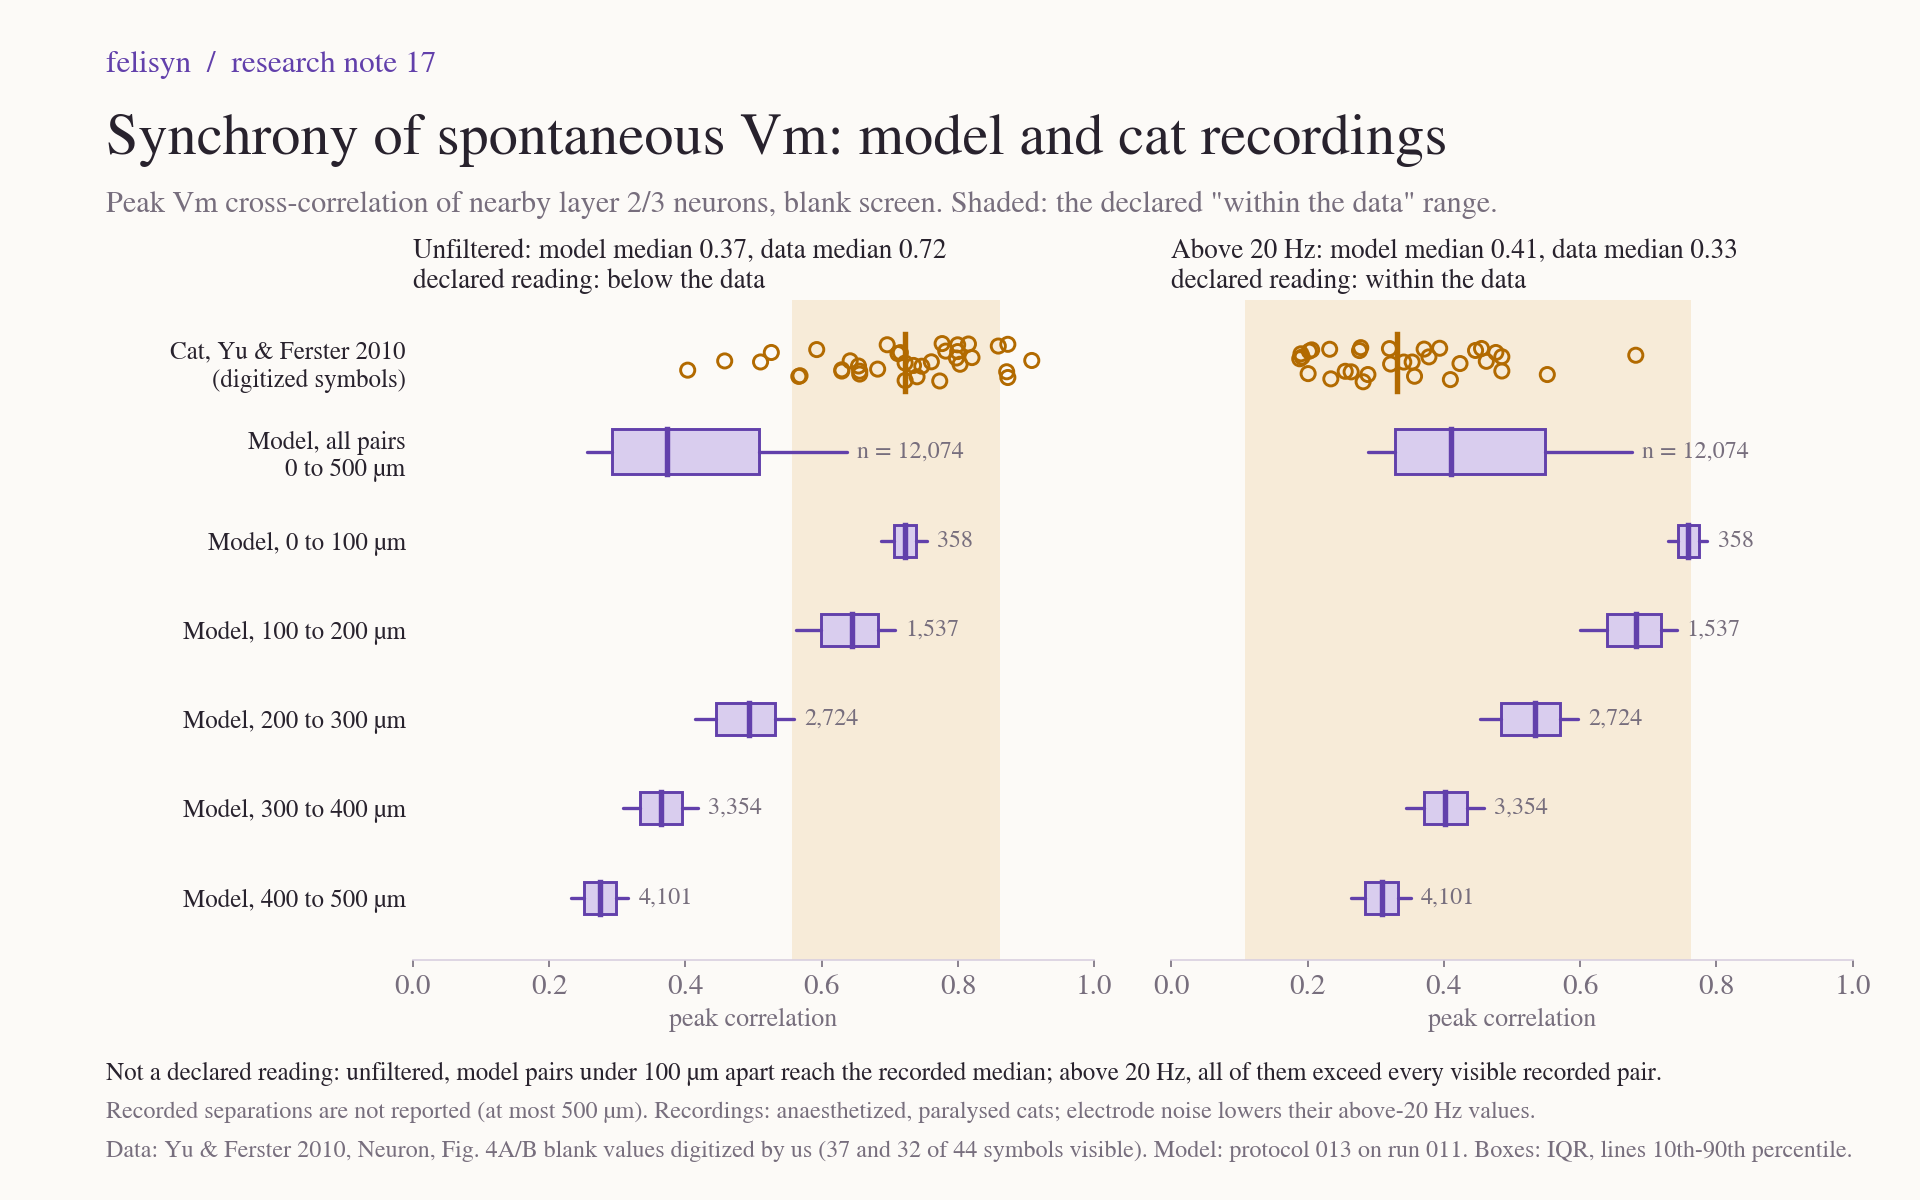
For the 12,074 pairs of layer 2/3 excitatory model neurons up to 500 µm apart, the median peak correlation is 0.37. The recorded pairs have a median of 0.72. That is below the data, as the declared reading puts it. Above 20 Hz, the model median is 0.41 against 0.33 recorded: within the data.
Distance matters a great deal in the model. Pairs under 100 µm apart have a median of 0.72, the same as the recorded median, while pairs 400 to 500 µm apart have 0.28. Yu and Ferster report only that their pairs were at most 500 µm apart. Different separations could therefore explain part of the unfiltered gap, but not all of it: above 20 Hz, every model pair under 100 µm exceeds every visible recorded pair, and their correlations are still only about 8 ms wide. This distance reading was not part of the declared comparison.
The model's correlations are also narrow, about 8 ms wide at half height, against 54 ms for Yu and Ferster's example pair. The model's coherence peaks near 38 Hz, while the recordings' spontaneous coherence falls with frequency.
The membrane time scale
The fitted time constant is about 4.5 ms for the median excitatory model neuron. All 1,597 model neurons fall between 3.8 and 6.0 ms. Azouz and Gray report 38 ± 26 ms. Every fit succeeded, and the declared variants, a different normalisation and a different way of removing spikes, change the result by at most 0.16 ms.
This short time scale is consistent with the model's own parameters. During spontaneous activity, its synaptic conductances shorten the effective membrane time constant to about 3 to 5 ms, and its synaptic time constants are 1.5 and 4.2 ms. So the model's membrane potential follows fast synaptic input. Part of that input is shared, enough to correlate close pairs at 0.7 or more, but it varies over milliseconds rather than tens of milliseconds. This explanation is our reading after the run; the protocol did not declare it.
What it means
As declared in advance, a model that is less synchronized than anaesthetized recordings is not, by itself, a failed model. Anaesthesia commonly drives the cortex into slow, synchronized fluctuations, and the model runs in an asynchronous state. The difference could reflect state, shared input, or both, and these recordings cannot separate them. Above 20 Hz, where slow state changes matter less, the model falls within the recorded range. That measure favours the model, because real recordings also contain electrode noise.
What the comparison does show clearly is that the model's spontaneous membrane dynamics are fast, and what neighbouring neurons share is fast too. These anaesthetized recordings are slow and share most strongly at low frequencies. Any later claim about the model's realism has to take that into account.
Limits
- One model run, one state and a 40 s window. The recordings are from anaesthetized, paralysed cats, from other neurons.
- The recorded synchrony values were digitized from a figure, with 37 and 32 of 44 symbols visible. Pair separations are not reported.
- The time constant compares a model median with a mean ± dispersion of unknown type.
- No awake or desynchronized-state membrane potential recordings were compared. Spike recordings from anaesthetized cats, some with desynchronized periods, exist: one dataset needs registration, and another is offered on request. They could test spike statistics, not membrane potential, and we have not obtained them.
Evidence and sources
- Protocol 013: the declaration, with its contract, digitization code, analysis code, tests and manifest.
- Comparison 014: the results, run log, result hashes, manifest and ZIP.
- Recordings: Yu and Ferster (2010), Neuron; Azouz and Gray (1999), Journal of Neuroscience.
- Model: Antolík et al. (2024), CC BY 4.0; LSV1M v1.0 (MIT); Mozaik (CeCILL).