A decision map on fresh instances
Note 27 tested a rule that turns two simultaneous signals into one of three actions (A, B or hold), but on held runs and on three strengths only. This note repeats the test on runs that did not exist when it was declared, and on a finer grid. Three new network instances were each built and run twice; the rule and its threshold from note 27 were used unchanged on a 5 by 5 grid of strengths. Declared outcome: PASS, the intended action in 168 of 168 scored steps. The cells where the two strengths differ by only 7.5 points were declared a transition zone and described, not scored: there the rule took the stronger signal's action in 66 of 72 steps and held in 6. A relay that adds the single responses would have erred in 3 of 30 cases. Six of the 14 scored cells repeat conditions note 27 had already tested, so a PASS there was likely; the other eight use strengths the model had not been shown. Three instances, four steps per cell, no runs without the cortex's own connections, and no market signal or action. Simulation only.
Note 27 declared a rule for a controller that receives two signals at once, and found that it took the intended action in 336 of 336 test steps. It also named its own weak points: the runs were held data whose summaries were already known, and the test used only three strengths per signal. The step it announced was a decision map over a finer grid of strengths, on fresh runs, with the threshold unchanged.
This note reports that step. The declared outcome is PASS: the intended action in 168 of 168 scored steps, over three network instances built for this test.
It is an engineering rule tested on model runs. No market signal entered and no action was taken.
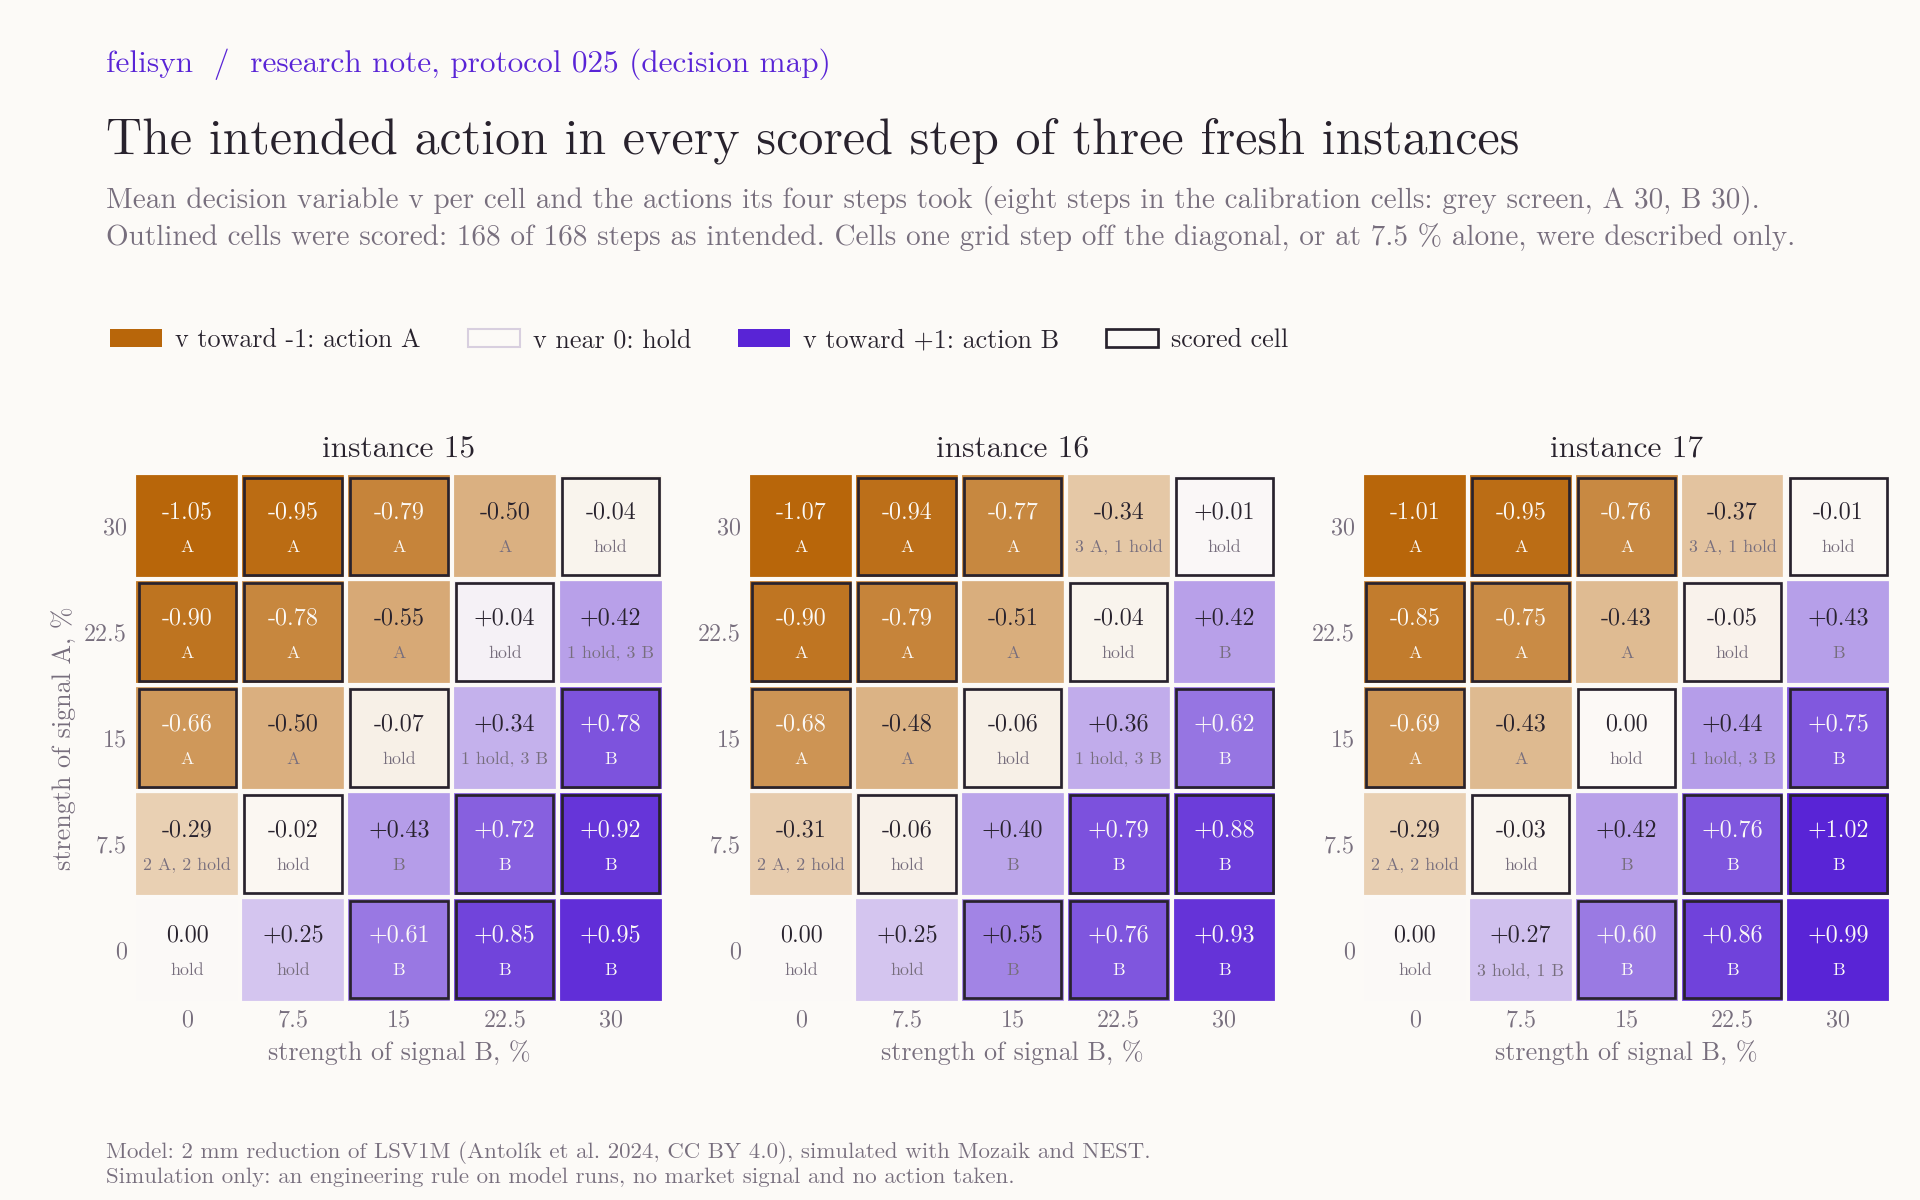
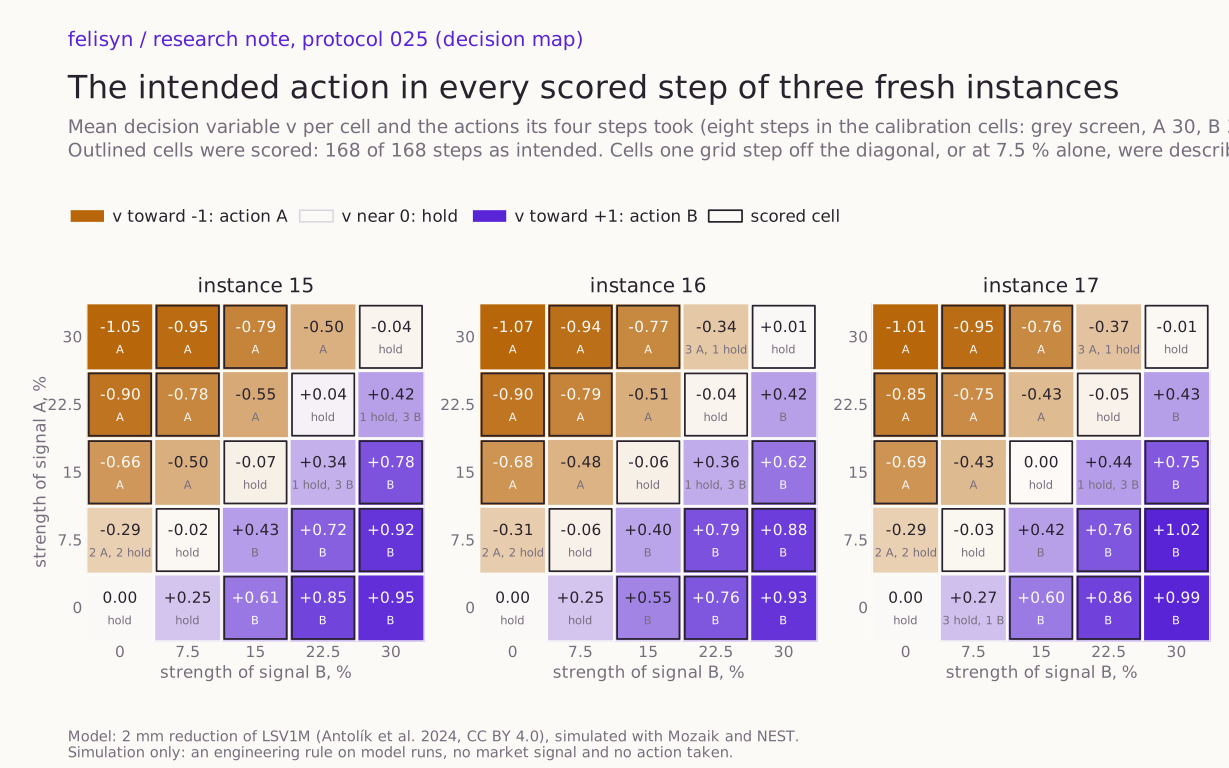
What was run
The rule is the one of note 27, with nothing changed. Two signals are shown together for one step of 210 ms, A as a grating at 45° and B as one at 135°, each signal's strength as its grating's contrast. One number, v, is read from the response of all layer 4 excitatory cells: roughly −1 for A alone at 30 %, +1 for B alone at 30 %. Action B if v is above 0.32, action A if it is below −0.32, hold in between. The threshold 0.32 was fixed on one network instance for note 27 and was not touched.
The grid is finer. Each signal takes the strengths 0, 7.5, 15, 22.5 and 30 %, which gives 25 combinations. Every combination was shown four times per instance, and the three that calibrate the instance (grey screen, A alone at 30 %, B alone at 30 %) eight times, in an order drawn separately for each instance.
The instances are new. Three network instances (seeds 15, 16 and 17) were built for this test; a search of our run folders and of the workspace on 13 November found no earlier run of them, and no plan of this project had named them. (An earlier research server is lost and could not be searched.) As in note 25, each instance was built and run twice, and counts only if the two runs agree on every spike. All three pairs agreed at the first attempt. No run failed, and the reserve instance was not needed.
What counts was declared beforehand. The frozen files were hashed and recorded at 14:58:29 UTC on 13 November; the first run started one second later.
- Scored, 56 steps per instance: two equal signals above zero should give hold; two strengths that differ by 15 points or more should give the action of the stronger, a single signal at 15 or 22.5 % included.
- Described, not scored: the eight combinations whose strengths differ by 7.5 points. We expected the decision to turn somewhere in there and declared it a transition zone.
- PASS if every instance takes the intended action in at least 51 of its 56 scored steps and the three together in at least 160 of 168.
How much of this was already known. Of the 14 scored combinations, four were also in note 27's test (15 with 15, 30 with 30, 30 with 15 and its mirror) and two more are its single gratings at 15 %. Note 27's result made a PASS on those six likely, and the declaration says so. The other eight contain 7.5 or 22.5 % and had not been shown to this model. A rehearsal of the run tools before the declaration showed four combinations of this grid for one step each on an older instance; those readouts were not used, and no number of the rule could change anyway.
The result
PASS: 56 of 56 on every instance, 168 of 168 in all. The tool ran twice and the two result files are byte-identical.
| Cells | Intended | Steps as intended | Mean v per cell and instance |
|---|---|---|---|
| Equal strengths: 7.5, 15, 22.5, 30 | hold | 48 of 48 | −0.07 to +0.04 |
| A stronger by 15 points or more | A | 60 of 60 | −0.95 to −0.66 |
| B stronger by 15 points or more | B | 60 of 60 | +0.55 to +1.02 |
Among steps meant to hold, the largest |v| was 0.180; among steps meant to act, the smallest was 0.470. The closest scored step lay 0.140 from a threshold. Note 27's closest step lay 0.026 away, but it had twice as many instances and twice as many steps per combination, and the extremes of a larger sample are expected to be wider, so this is not evidence that the margins improved. On average, two equal signals cancel almost exactly at every strength tested, from 7.5 to 30 % (cell means −0.07 to +0.04); single steps reach 0.18.
The transition zone
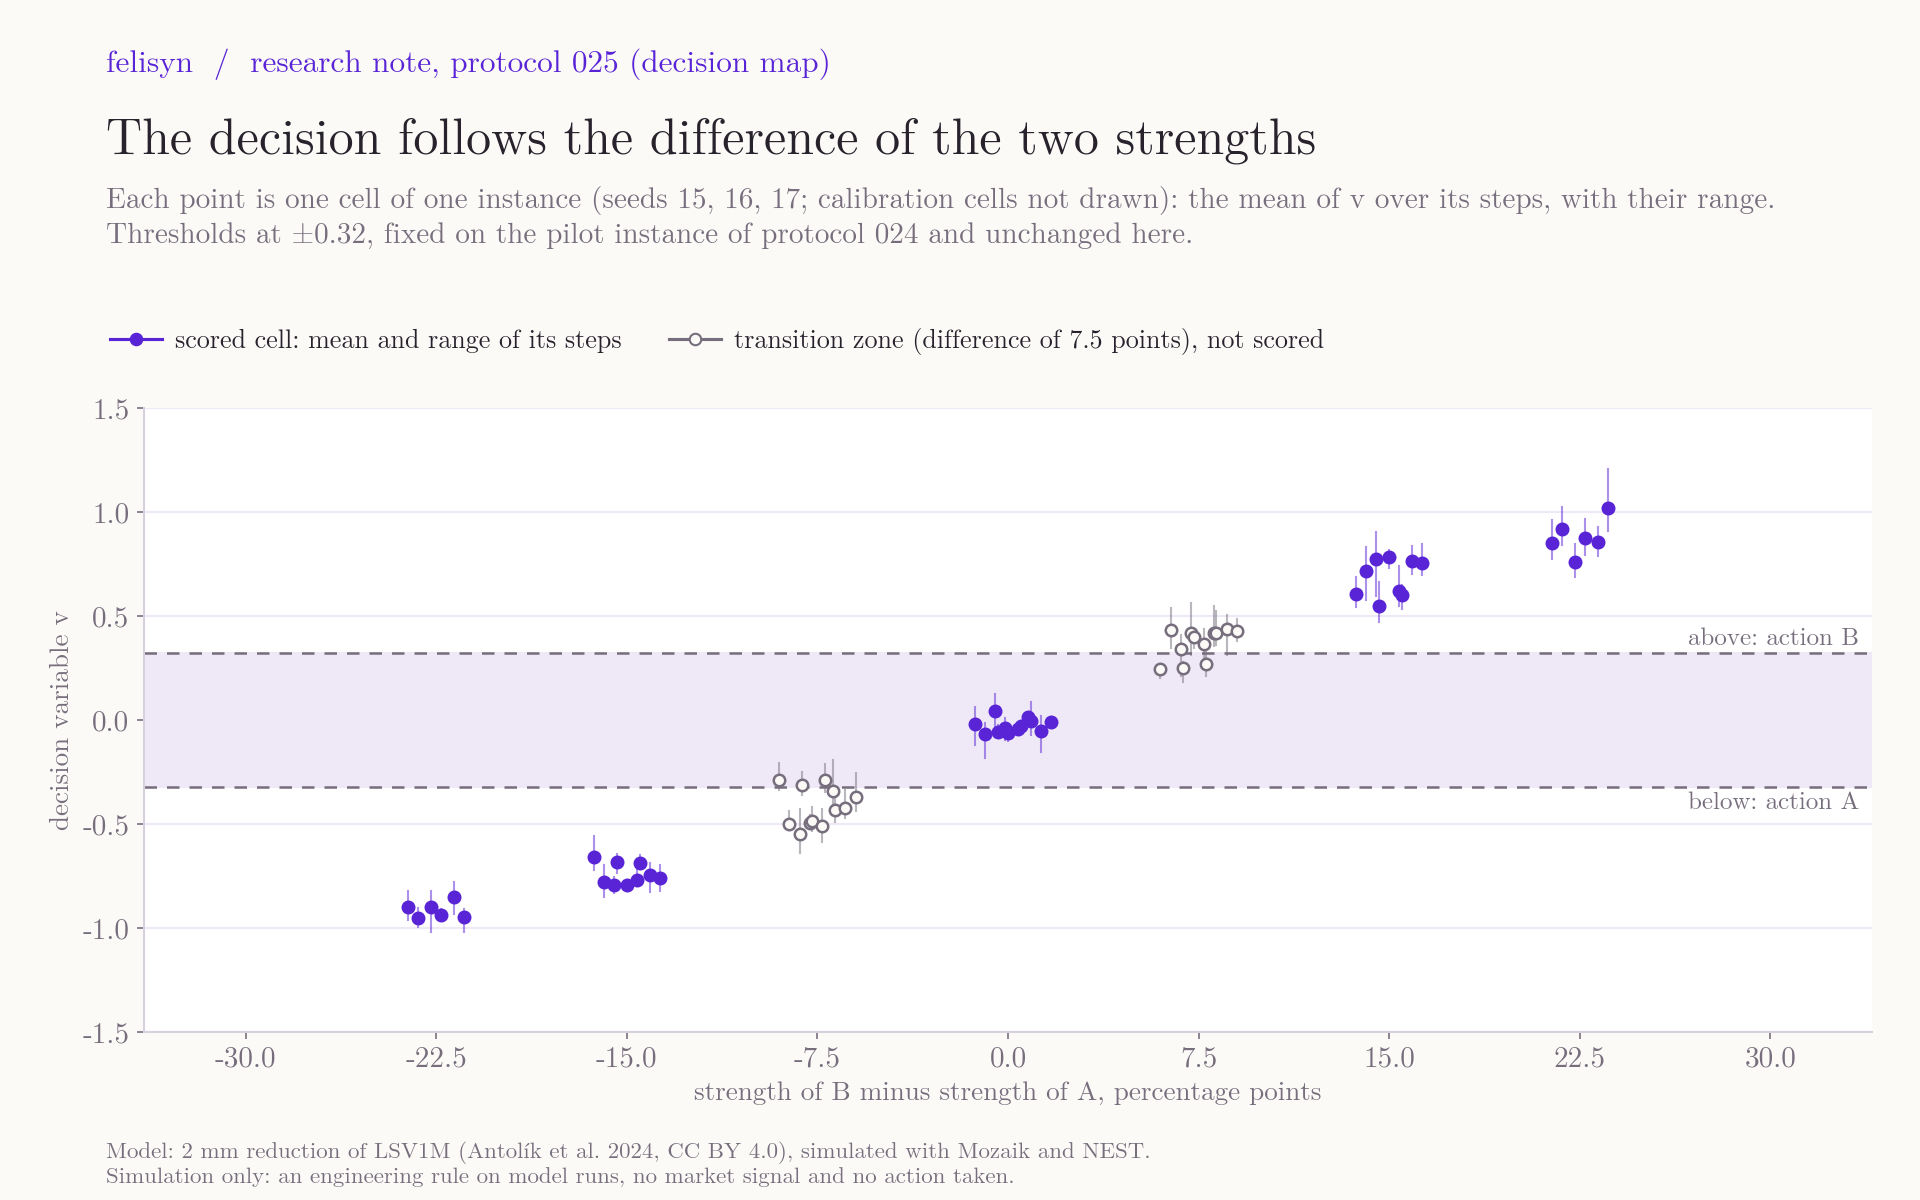
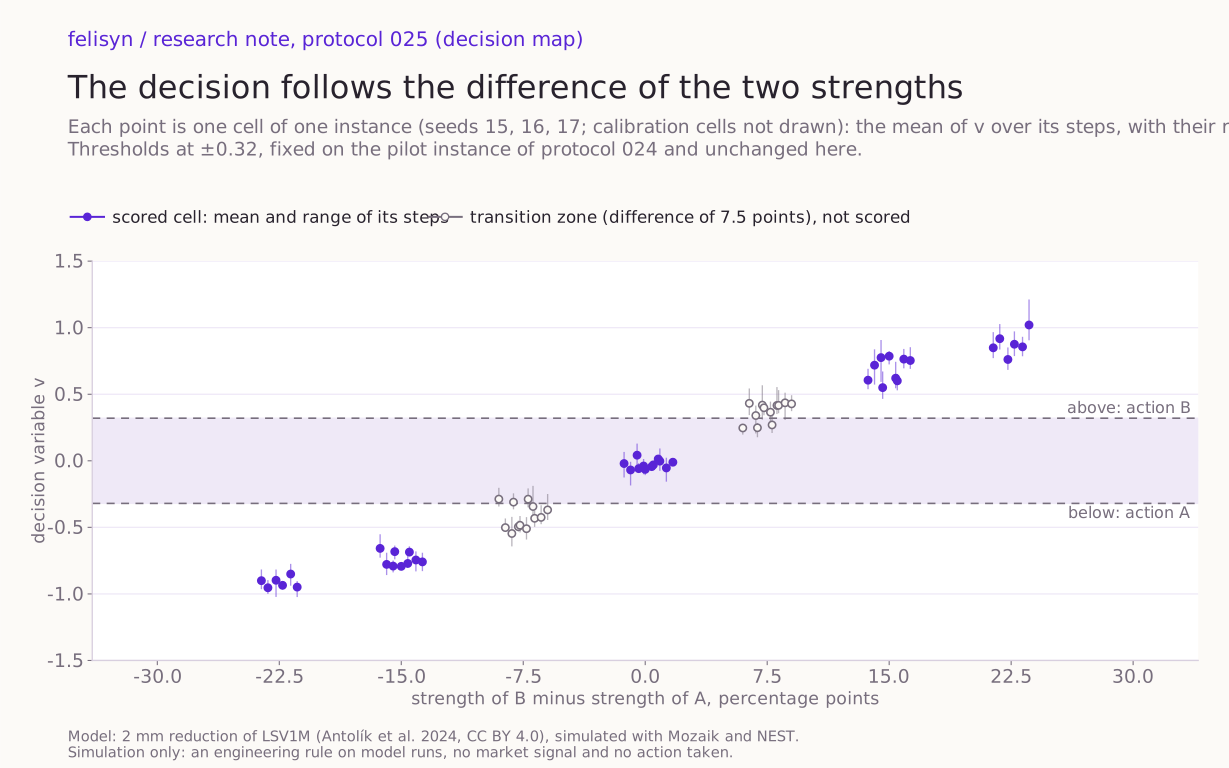
The eight combinations with a difference of 7.5 points were not scored. What the rule did there is the descriptive result of this note.
| Combination (contrast in %) | A | hold | B | Mean v per instance |
|---|---|---|---|---|
| A 15 + B 7.5 | 12 | 0 | 0 | −0.50 to −0.43 |
| A 22.5 + B 15 | 12 | 0 | 0 | −0.55 to −0.43 |
| A 30 + B 22.5 | 10 | 2 | 0 | −0.50 to −0.34 |
| A 7.5 + B 15 | 0 | 0 | 12 | +0.40 to +0.43 |
| A 15 + B 22.5 | 0 | 3 | 9 | +0.34 to +0.44 |
| A 22.5 + B 30 | 0 | 1 | 11 | +0.42 to +0.43 |
| A alone, 7.5 | 6 | 6 | 0 | −0.31 to −0.29 |
| B alone, 7.5 | 0 | 11 | 1 | +0.25 to +0.27 |
- With two signals 7.5 points apart, the rule sided with the stronger one in 66 of 72 steps and held in the other 6. It never took the weaker signal's action.
- One signal alone at 7.5 % sits at the threshold. A alone gave action A in half of its steps, B alone gave action B in 1 of 12. At 15 % a single signal was always acted on; strengths below 7.5 % were not tested.
- The decision follows the difference more than the level, with one exception. This reading was made after the result and was not declared. With two signals present, a lead of 7.5 points gives a mean |v| between 0.34 and 0.55 whether the pair is weak (7.5 against 15) or strong (22.5 against 30). A single signal gives less than a pair with the same lead: 0.25 to 0.31 alone at 7.5 %, and 0.55 to 0.69 alone at 15 % against 0.62 to 0.79 for pairs 15 points apart.
In one sentence: the rule holds when the two signals are equal, acts reliably when one leads by 15 points, and between those it mostly acts for the leader and sometimes holds.
What a relay would have done
As in note 27, we also asked what the same thresholds would give if the circuit simply added its responses to the two gratings shown alone. This has no role in the outcome.
Over the 30 scored combinations of two signals and instance, the relay rule gives the intended action in 27. The three misses are the same combination in all three instances: A at 15 % with B at 30 %. The summed single responses stay just inside the hold band there (+0.24 to +0.31), while the circuit's actual response is +0.62 to +0.78. Note 27's relay rule missed on the same combination (and once more on two equal signals at 30 %), for the same reason: a weak grating alone already evokes most of the response of a strong one, so the sum is small, but in the plaid the stronger grating suppresses the weaker.
What this does and does not show
- It addresses note 27's first caveat, in part. That test reused held runs. This one was declared before its runs were made, and the rule passed again with no change to any number. Six of the 14 scored combinations repeat note 27's conditions; the new information is in the other eight and in the transition zone.
- It is three instances with four steps per cell. With no error in 168 scored steps, an error rate of up to about 1.8 % per step is still compatible with the data at the 95 % level. The score is not a guarantee.
- The scored cells leave the close calls out, by declaration. The transition zone is where a real controller's signals would often fall, and there the rule is not uniform: 6 of 72 two-signal steps held where the leader was 7.5 points ahead. What a controller should do with that is a design decision, not a finding.
- It does not show that the cortex's own connections make the decision. Note 27 found that the rule also works on its design instance with every connection inside the cortex set to zero. No such runs were made here. The rule reads the whole model, input stage and cortex together.
- It is narrow. One pair of orientations, one timing, one orientation map shared by all instances, strengths up to 30 %, one step per decision, calibration from the same run.
- The scoring came a week after the runs. The six runs ended on 14 November at 03:39 UTC; the results were computed on 21 November with the frozen tool, whose hash is in the declaration and in the result file. Nothing was changed in between.
- It involves no market and no action. What signals A and B would stand for, and what actions follow, is not part of this protocol.
- It is simulation only, and no claim about cat visual cortex.
Next
- Decisions over time. Each decision here used one step of 210 ms. Whether a short run of steps removes the occasional hold in the transition zone is the next declared question.
- A third input. Note 27 found that a stronger grating at another orientation masks a weak signal. A controller needs either a guard against that or a declared behaviour for it.
Status on 21 November: neither has been declared.
Evidence and sources
- Decision map 025: the package, with:
- the declared results, computed twice (second file, byte-identical);
- the declared spec, the tool, its tests, the run queue and the frozen manifest;
- the queue's log and the receipts of all six runs, with each instance's comparison record (for example instance 15);
- the analysed export of each instance (15, 16, 17);
- the figures with their data and scripts, and the package manifest.
- Note 27 and decisions 024, where the rule and its threshold were fixed.
- Protocol 017, whose readout the rule uses.
Model: Antolík et al. (2024), CC BY 4.0; LSV1M v1.0 (MIT); Mozaik v0.4.0 (CeCILL); NEST 3.4 (GPL); the NEST step current module, whose patched files state the GPL; PyNN 0.11.0 (CeCILL); GSL 2.7.1 (GPL). The rule, its test and the figures are ours.