Second test against cat recordings: shared fluctuations in firing
We compared how strongly groups of neurons in the full model fluctuate together in their spontaneous firing with open multiunit recordings from cat area 17, under a protocol frozen before any of these measures was computed. Within each second, the model's groups share 8 to 64 times less fluctuation than the cats' recording sites, even in the cats' least synchronized states. In a secondary measure, the gap is largest on slow time scales. The cats were anaesthetized, so this describes a difference; it is not a pass or fail.
Note 17 compared the full model's spontaneous membrane potential with intracellular recordings from cat visual cortex. The model's membrane potential was faster and less synchronized than in the recordings. This note asks the same kind of question with spikes: how strongly do separate groups of neurons fluctuate together in their spontaneous firing? We compared run 011 (note 15) with spike recordings from area 17 of four cats, published openly by Hahn et al. (2017). Using them needed no account and no request.
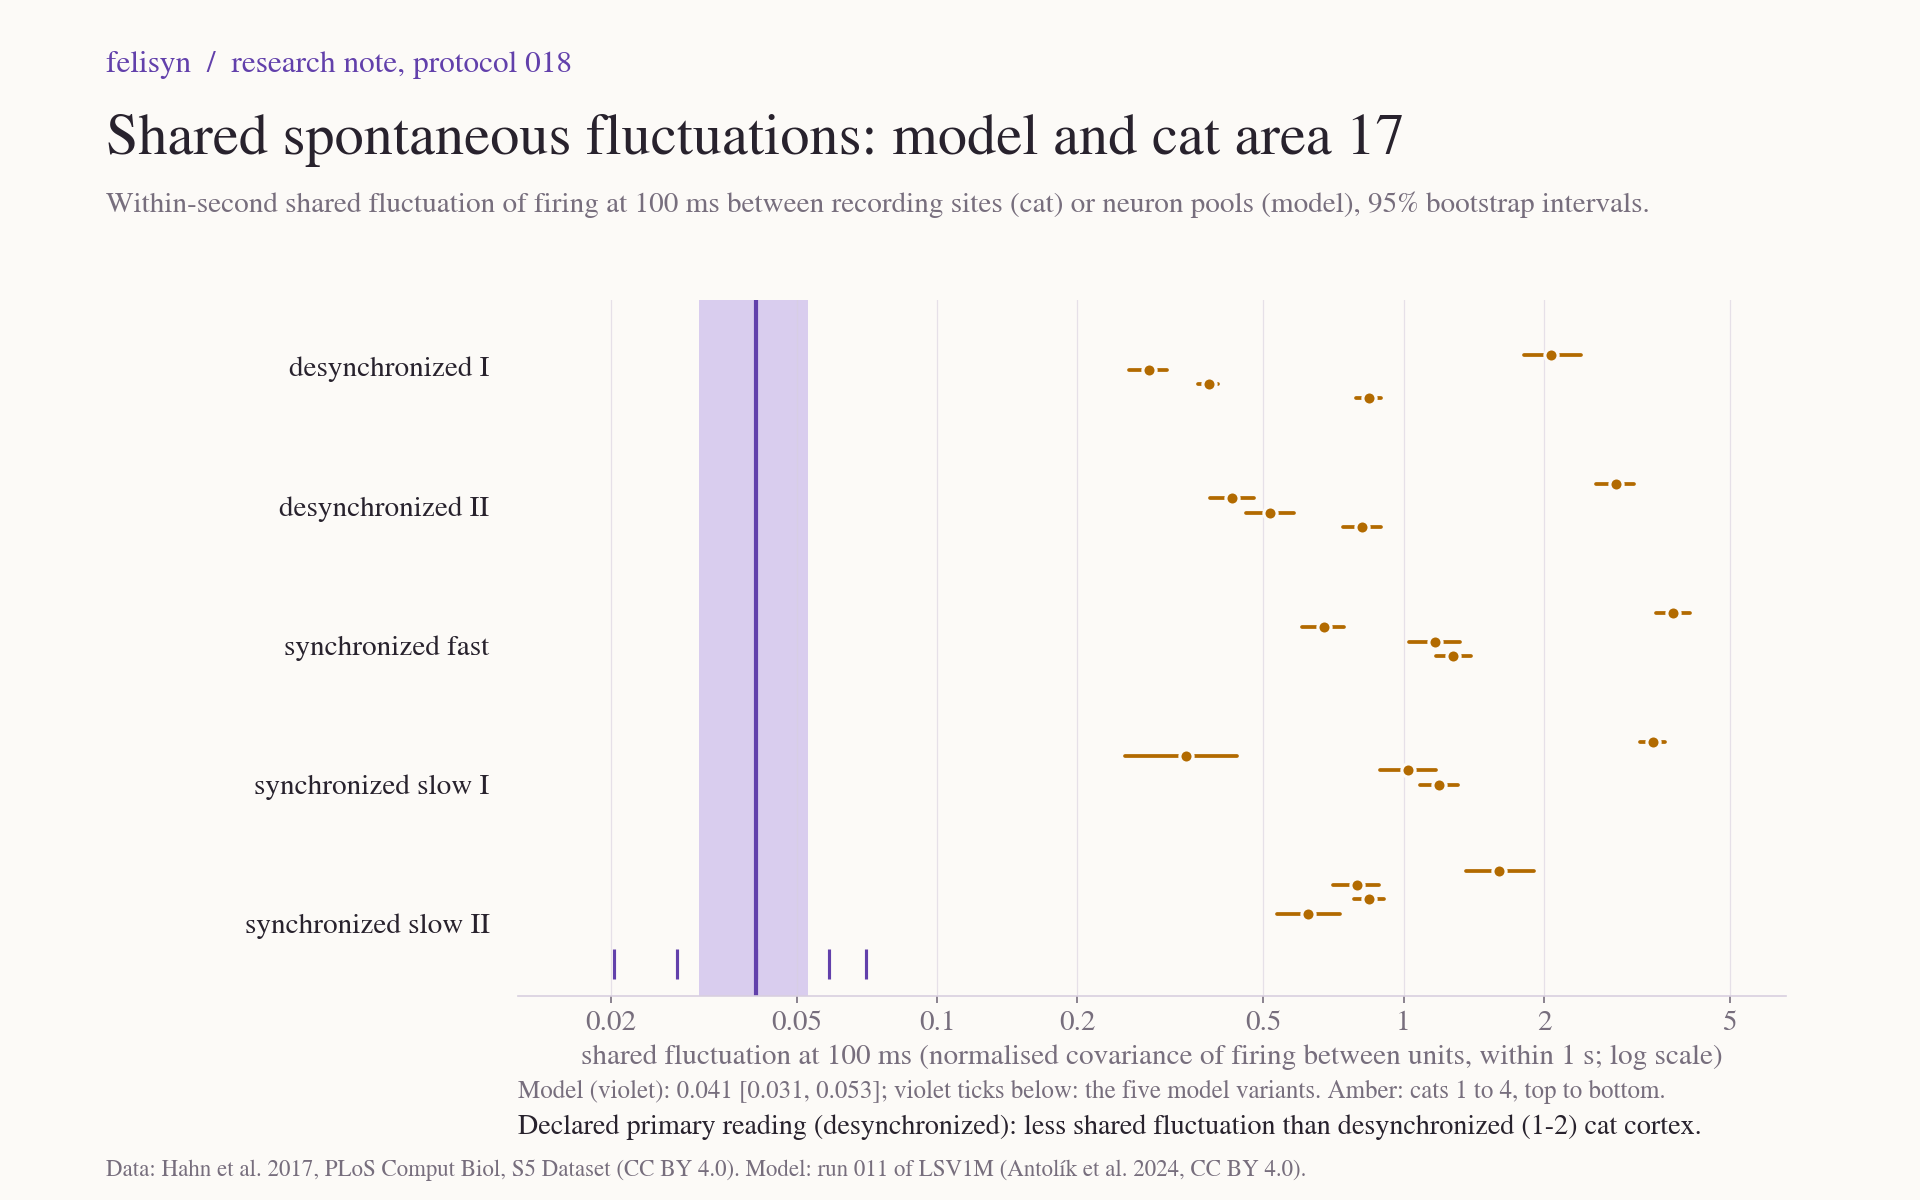
The headline: within each second, groups of model neurons fluctuate together far less than recording sites in cat cortex. The model's value is 0.041, against 0.34 to 2.6 in the cats' desynchronized states, the least synchronized states in these recordings. That is 8 to 64 times lower. In a secondary measure, the gap is largest on slow time scales: counted in 10 ms bins the model comes close to cats 2 and 3, while in 250 ms bins it is 18 to 99 times lower. This agrees with note 17. The cats were anaesthetized, and anaesthesia commonly produces slow, synchronized fluctuations. The model's own fast membrane and synapses could also contribute, and these data cannot separate the two. This result describes a difference; it is not a verdict on the model.
The recordings
- Preparation. Four cats, anaesthetized with isoflurane and paralysed, recorded in darkness. Each had a 32-contact silicon array in area 17: four shanks of eight contacts, 400 µm apart along a shank.
- Spikes. They were detected with a threshold and not sorted into single neurons. Each recording site therefore picks up multiunit activity, a mixture from several nearby neurons. The cats have 27, 26, 22 and 12 sites and 65 to 100 minutes of recording each.
- States. The authors labelled every second by clustering the spectrum of the local field potential into five states: two desynchronized, one synchronized fast and two synchronized slow. The analysis used 16,406 desynchronized and 4,994 synchronized seconds in all.
- Independence. The model's paper does not cite this dataset. Two authors worked on both, so it is an independent publication but not an independent laboratory.
A measure that does not depend on the threshold
How many spikes a site records depends on where its threshold was set and on how many neurons it picks up. Neither is known, so absolute firing rates and correlations cannot be compared with the model. One quantity survives: the covariance of two spike counts divided by the product of their means. If detection deletes spikes at random, this ratio stays the same. It measures how strongly the underlying firing rates of two groups of neurons move together.
The primary measure applies it within each second. Spikes are counted in 100 ms bins, each unit's counts are taken relative to its own mean in that second, and only pairs of different units are combined. A unit's own variability therefore does not count, and neither do slow drifts from one second to the next. In the cats a unit is a recording site. In the model, where every neuron is known, we formed 18 pools that play the role of recording sites: one in layer 4 and one in layer 2/3 at each point of a 3 × 3 grid with points 400 µm apart, each holding the 45 to 72 neurons within 100 µm of its point. Variants used excitatory neurons only, inhibitory neurons only, pools 800 µm apart, single neurons, and the recording without its first 2 s.
Declared before we looked
Protocol 018 fixed the data, the model units, the measures, the uncertainty and the readings before any of these measures was computed. Beforehand we had looked only at the format and structure of the cat data, and at the model statistics already published in notes 15 and 17. Every estimate gets a 95 % interval from resampling whole seconds. The reading compares the model's interval with the range spanned by the four cats' intervals: below it, within it or above it. The primary comparison is with the desynchronized states, because the model runs in an asynchronous state.
The protocol was reviewed three times before it was frozen. The first review changed the primary measure. Our draft measure, the variance of the summed count, also contains each unit's own variability, weighted by one over the number of units. That weight is large for a dozen recording sites and negligible for thousands of model neurons, so the draft would have pushed the model down. The second review added a check for recording artifacts, and the third tightened it. The protocol's SHA-256 was recorded at 21:32:20 UTC on 23 October. The analysis started 25 seconds later and took six and a half minutes.
The result
Shared fluctuation at 100 ms, with 95 % intervals. The cats' values are for their desynchronized states.
| Value | 95 % interval | |
|---|---|---|
| Model | 0.041 | 0.031 to 0.053 |
| Cat 1 | 2.62 | 2.43 to 2.82 |
| Cat 2 | 0.341 | 0.318 to 0.364 |
| Cat 3 | 0.404 | 0.385 to 0.424 |
| Cat 4 | 0.834 | 0.791 to 0.878 |
The declared reading is "less shared fluctuation than desynchronized (1-2) cat cortex". It holds everywhere the protocol said it would be checked:
- In every cat state, each of the five separately and the synchronized states pooled.
- For every model variant, whose values range from 0.020 (pools 800 µm apart) to 0.071 (single neurons).
- With possible artifacts removed from the data (below).
The model's value is small but real. With each pool's spikes redistributed at random within each second, it falls to 0.0000, with a 95 % range of ±0.0006. The cats also differ from one another by a factor of almost eight. In every cat the synchronized seconds, pooled, give a higher value than the desynchronized ones: 2.99 against 2.62, 0.64 against 0.34, 0.92 against 0.40 and 1.04 against 0.83. That was not a declared reading, and it does not hold for every single state: the synchronized slow II state of cats 1 and 4 is lower, and cat 2's synchronized slow I is level. On the whole, though, the measure follows the authors' state labels.
Possible artifacts
Electrical noise that crosses the threshold on several contacts at once would add shared fluctuation to the data. The protocol therefore counted events in which three or more sites fire within 0.2 ms of each other. In cat 1 they hold 5.5 % of all spikes; in the other cats, at most 0.4 %. These data cannot tell whether cat 1's events are artifacts or genuinely precise synchrony. Removing them lowers cat 1's desynchronized value by 11 % and the other cats' by less than 2 %, and the reading does not change.
Fast in the model, slow in the cats
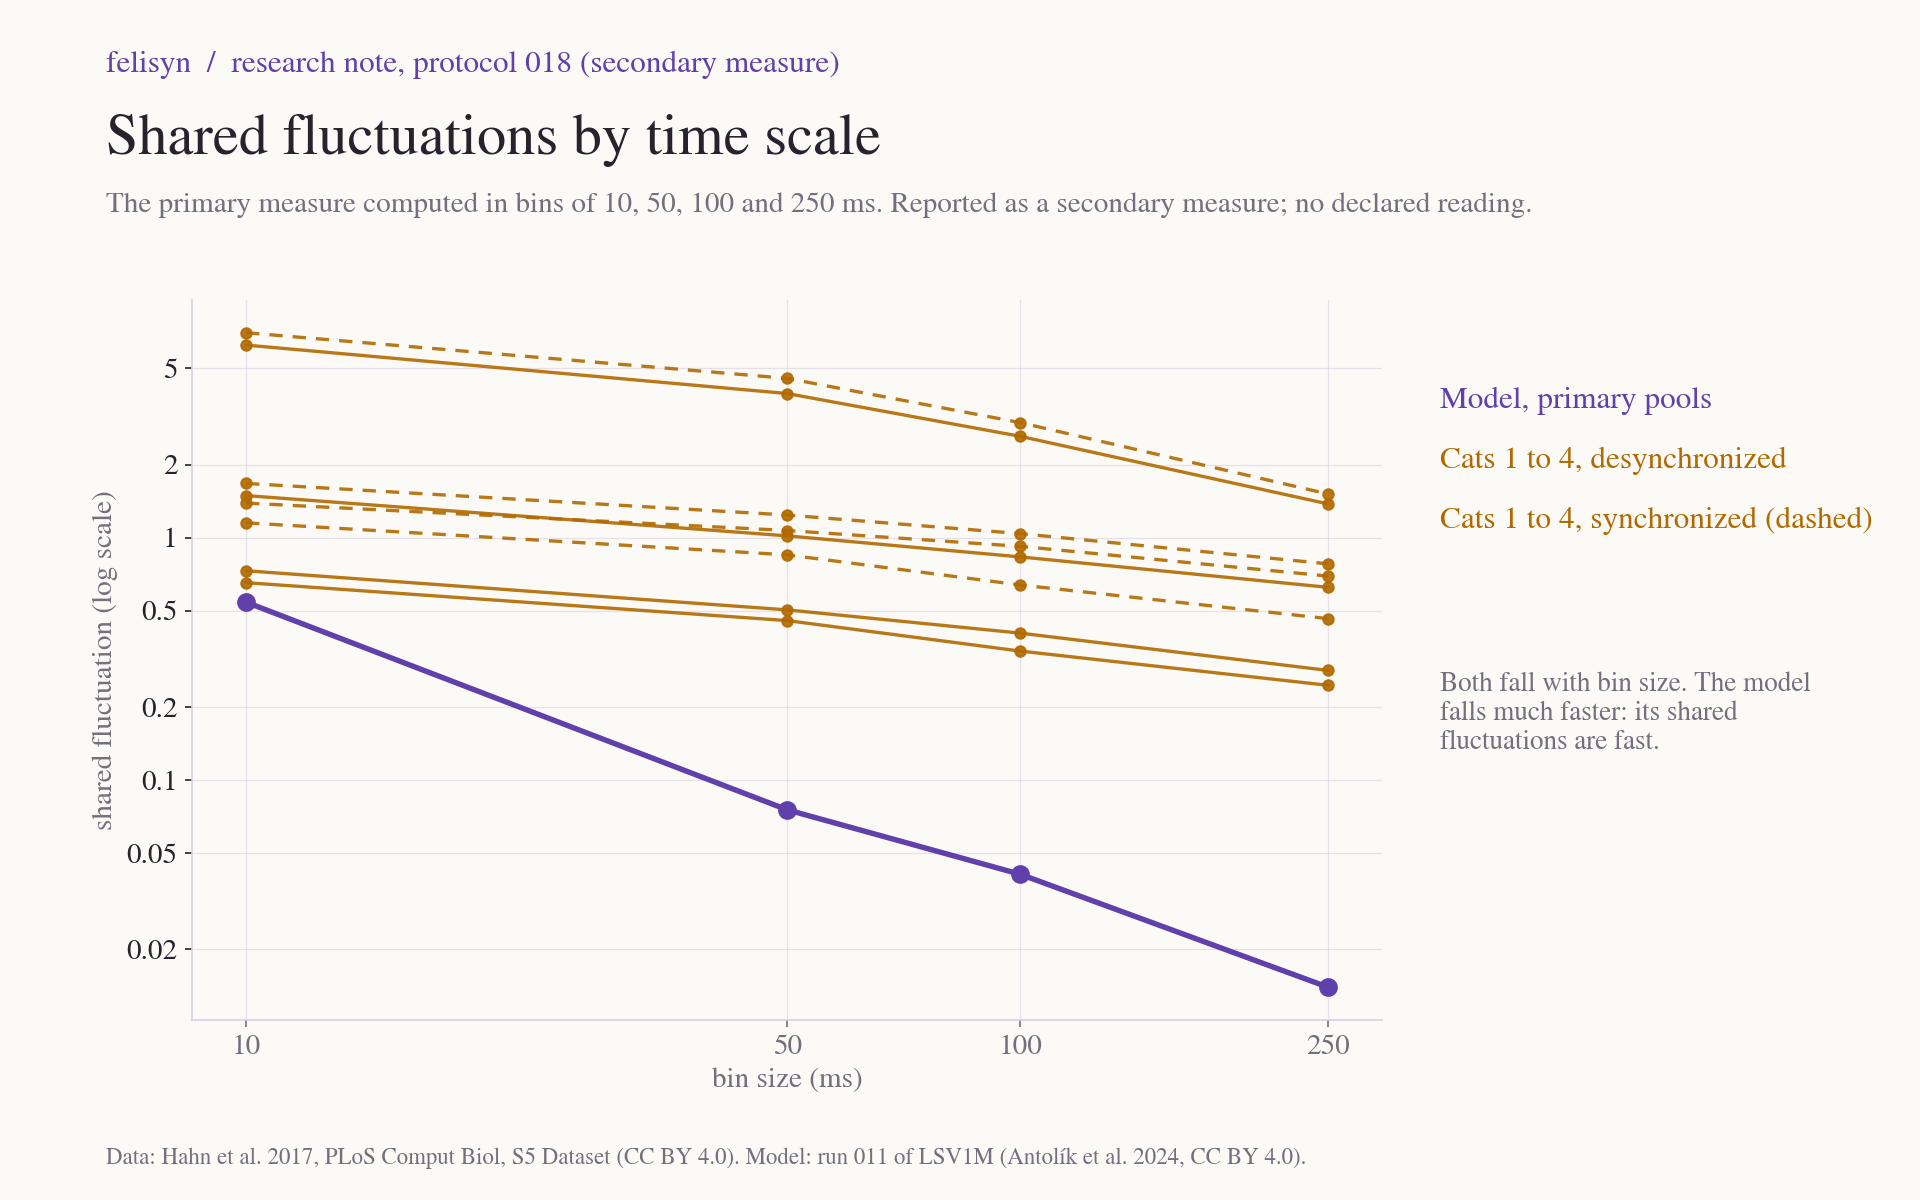
The protocol also asked for the same measure with bins of 10, 50 and 250 ms. From 10 to 250 ms the model's value falls by a factor of 39, while the cats' desynchronized values fall by factors of 2.4 to 4.5. What the model's neuron groups share is concentrated at short time scales, and little of it remains when spikes are counted over a quarter of a second. In the cats it persists over hundreds of milliseconds. This matches note 17, where the model's membrane potential decorrelated about eight times faster than in the recordings. This was reported as a secondary measure, without a declared reading.
What it means
As declared in advance, a model below the desynchronized range agrees with note 17 and is not, by itself, a failed model. The cats were anaesthetized, recorded in darkness and sampled as multiunit activity, and each of these differs from the model's condition. These data cannot separate them. The desynchronized seconds were also chosen by the authors' clustering for low synchronization, so that reference sits low by construction. The model is still at least eight times lower.
Two comparisons with independent recordings, one of membrane potential and one of spikes, now point the same way. During spontaneous activity, what model neurons share is concentrated at short time scales, and at 100 ms and beyond it is much smaller than in the cats. In anaesthetized cat cortex, shared fluctuations extend over hundreds of milliseconds. In this note the time-scale part is a secondary measure without a declared reading. Whether the difference comes from the anaesthetized state or from the model is the open question. Spontaneous recordings from awake cats would help to answer it; none were among the open datasets we found.
Limits
- One model run in one state, 40 s of a grey screen, against hours of anaesthetized cat cortex in darkness. The cats' states come from their local field potential, which does not define the model's state.
- Detection is only approximately random deletion. Independent noise crossings would lower the data's values, and common-mode events would raise them. The artifact check covers near-simultaneous events on three or more sites.
- The depth of each contact and the spacing of the shanks are unknown. The model units are declared choices, and the variants did not change the reading.
- This is a consistency check on one family of measures, not a validation of the model.
Next
The decision test frozen in note 18 (protocol 017) is running on our server. Its three runs are expected to finish on 24 October.
Evidence and sources
- Protocol 018: the declaration, with its contract, measures, analysis code, tests, the dataset as downloaded and manifest.
- Comparison 019: the results, run log, plotting code, manifest and ZIP.
- Recordings: Hahn et al. (2017), PLoS Computational Biology, S5 Dataset, CC BY 4.0.
- Model: Antolík et al. (2024), CC BY 4.0; LSV1M v1.0 (MIT); Mozaik (CeCILL).